Step 4 - Suburb Selection
Ok, let's get into the meat and potatoes of identifying where you should be investing (finally…).
Please remember this section isn't supposed to be some infallible system for you to identify the next hotspot, it is purely here to help those who are either using a buyer's agent and want to sense check the areas they are being presented or to give some direction / useful background to those looking to start their DIY-investing journey.
Data filtering process
I (and most other investors) generally break down the suburb selection process into two parts:
Suburb specific factors (i.e. micro)
City / Region specific factors (i.e. macro)
What a lot of people do is they start too broad and they start with researching macro-economic factors in order to identify areas to invest in, or in other words, they try to identify what state or city to invest in first then look at the specific suburbs - that is ok if you are a qualified economist, but for the average punter I wouldn't recommend it.
Instead, we want to analyze the data from the inside out - i.e. start with identifying suburbs with strong data, then analyze the city / region the suburb is located in to see if it is in a location with investment grade fundamentals.
Think of it like a filtering system, sort of like those fancy drip coffees they make at some cafes (I can't stand them to be honest…)
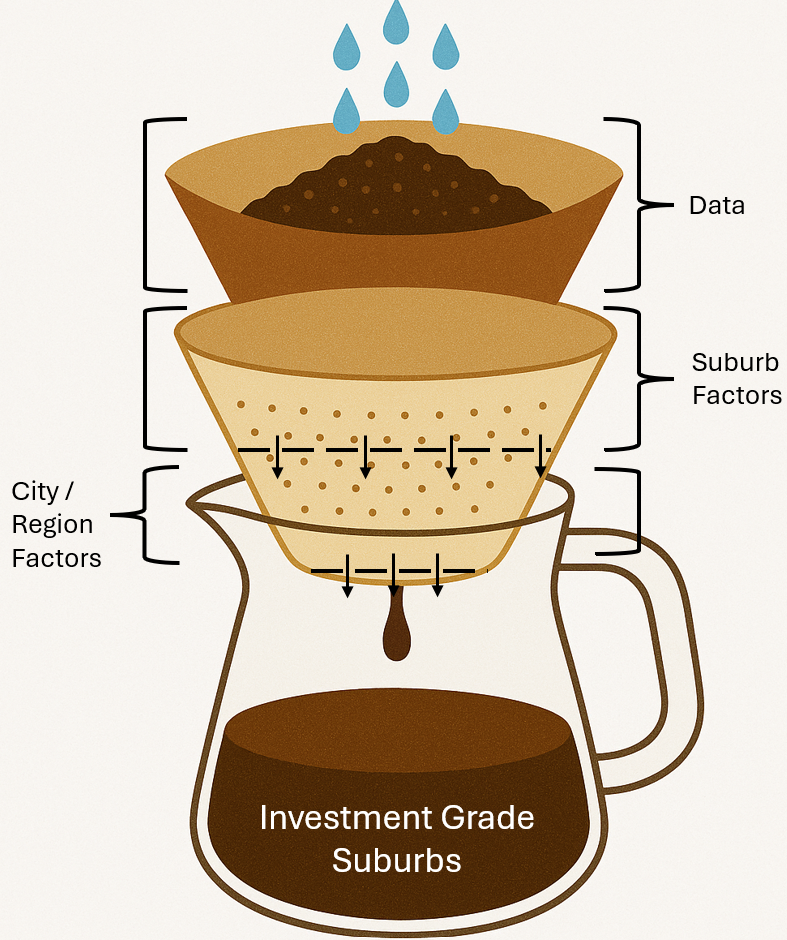
Investment grade suburb data factors
Over the next few pages I will outline the key data metrics you want to be using as filters to help you in identifying the best suburbs to be investing in for capital growth. Believe it or not, but these are generally the metrics that the buyer’s agents also look at it.
In particular, I have seperated all the data factors into the following categories:
Suburb Factors:
Fundamental factors: these are a mix of strategy / brief specific and fundamental factors which will remove the majority of 'non-investment grade' suburbs
Supply Factors: these are the most important factors in my opinion, they measure how much supply of housing is currently available in the markets as well as what supply looks like in the future.
Demand Factors: these factors are also very important, they measure how much demand there is for housing in certain markets - in other words, these will show you which markets are hot, warm and cold.
Market Cycle Timing Factors: these factors will ensure that you are buying in an area that is about to experience its growth run and not an area approaching its peak.
City / Region Factors:
These factors will cover a range of general economic metrics which are important in ensuring you are investing in areas which match your risk tolerance and that you are not investing in areas which are undiversified / single-industry economies. This will be more relevant for when you are a looking in suburbs that are outside of the major capital cities.
When looking at these data factors there is a few things you need to keep in mind:
This is not a perfect science and there are no perfect suburbs. Meaning that there will be no suburb that perfectly meets all of the criteria that I set out, which means that you will need to be flexible with some of the data and make compromises. If not, you will be stuck in analysis paralysis mode forever and never actually invest.
I have included some suggested target ranges (as opposed to one specific value) for each data point as well as indicated which criteria you could be more flexible on and those which you may want to be more strict on in order to assist you with making trade-offs - because you will need to make trade-offs. But remember, data is actually very rigid which means that if you apply everything too strictly you may miss out on a perfectly good suburb because it was one digit above the target range. For example, if you only look at suburbs with a typical price of $600,000, you may miss a suburb that ticked every other box but had a typical price of $605,000 - that is the danger of applying a very strict / specific filtering system, so make sure you give yourself some flex.
I have also included a section on trend analysis where relevant. It is important to remember that the trend of the data is just as important as the specific data point. For example, suburb ‘A’ may have a days on market of 35 days but it has been consistently trending upwards over the past few months - meaning demand is strong but it is weakening over time, whereas suburb ‘B’ could have 40 days on market but it is consistnetly trending downwards meaning demand is sold and it is improving over time - i.e. suburb B would be preferable. Remember how we talked about data trends being more reliable in property because it is an illiquid asset… this means it is vital you consider the trends of the data, not just the specific values in isolation. This ‘trend’ concept will make more sense as you read through the next few pages…
Purpose of the data filtering process
The point of this process is to narrow down the amount of suburbs for you to look at from over 15,000 to approx. 3 - 5 suburbs. Using the paid data sources I have mentioned before is really the only way to do this effectively in my opinion, so make sure you have subscribed to one of these if you want to actually use these factors to find investment grade suburbs.
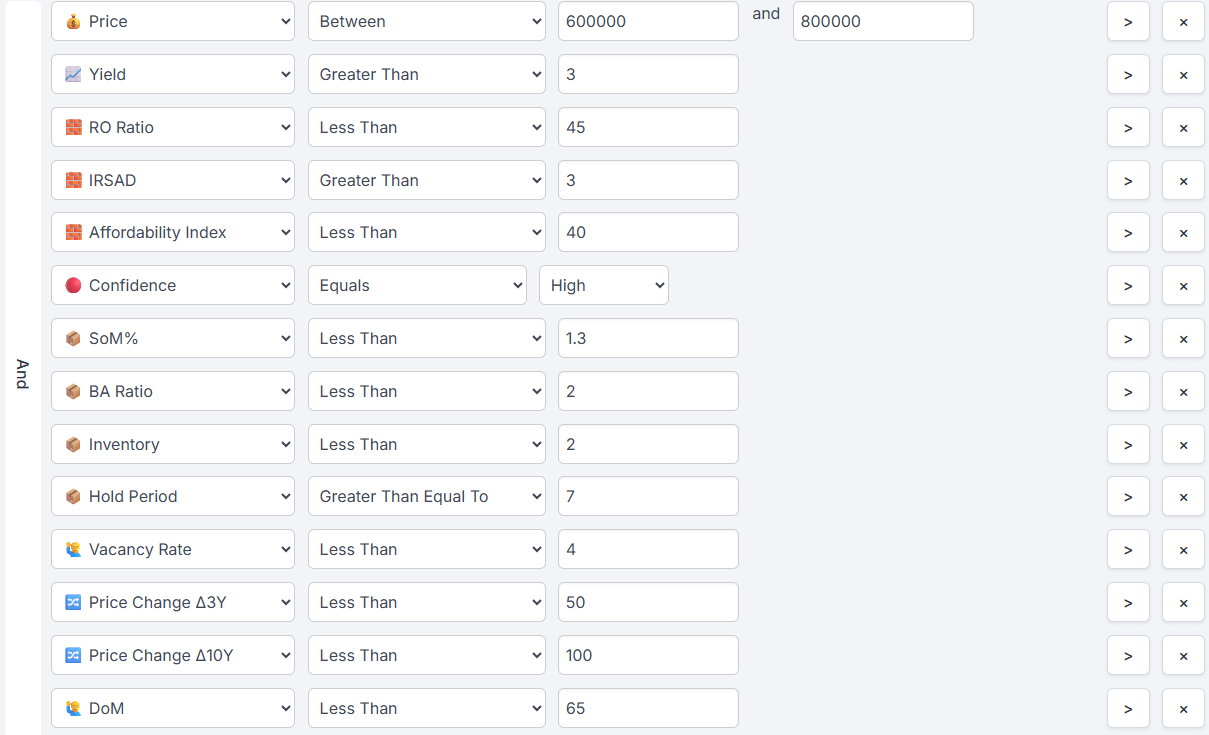
To show you the power of using this filtering process through the paid data sources I have included a few worked examples using HtAG and DSR so you can see understand how you will practically apply this system (for reference, this is just an example way of using the systems, there are plenty of others more effective ways to use these platforms and other data factors to consider - this is purely for illustrative purposes only, please don’t blindly copy this).
In summary, what you will be doing is using the suburb factors to filter through all the suburbs in Australia using these paid data platforms so you get a smaller sample size of areas which you can then proceed to undertake a comparative analysis of these suburbs on a deeper level and look at the specific trends in the suburb factors as well as whether the city / region factors also stack up. I will go through this in more detail later, but I thought this would be useful so you get a visualisation and understanding of the direction we are heading in.
(a) HtAG sample
(b) DSR sample
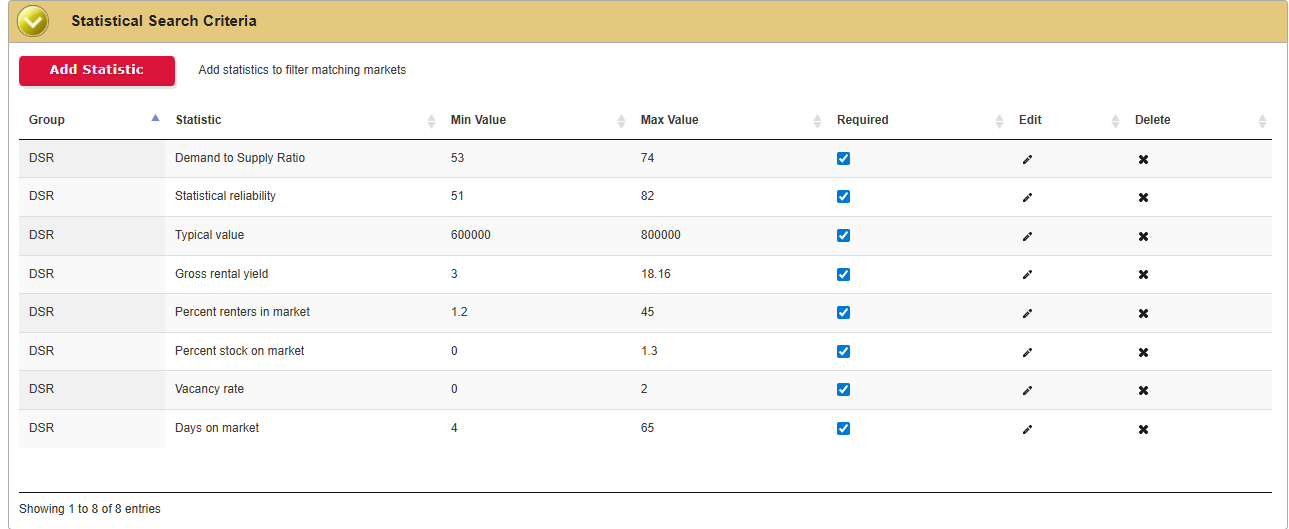
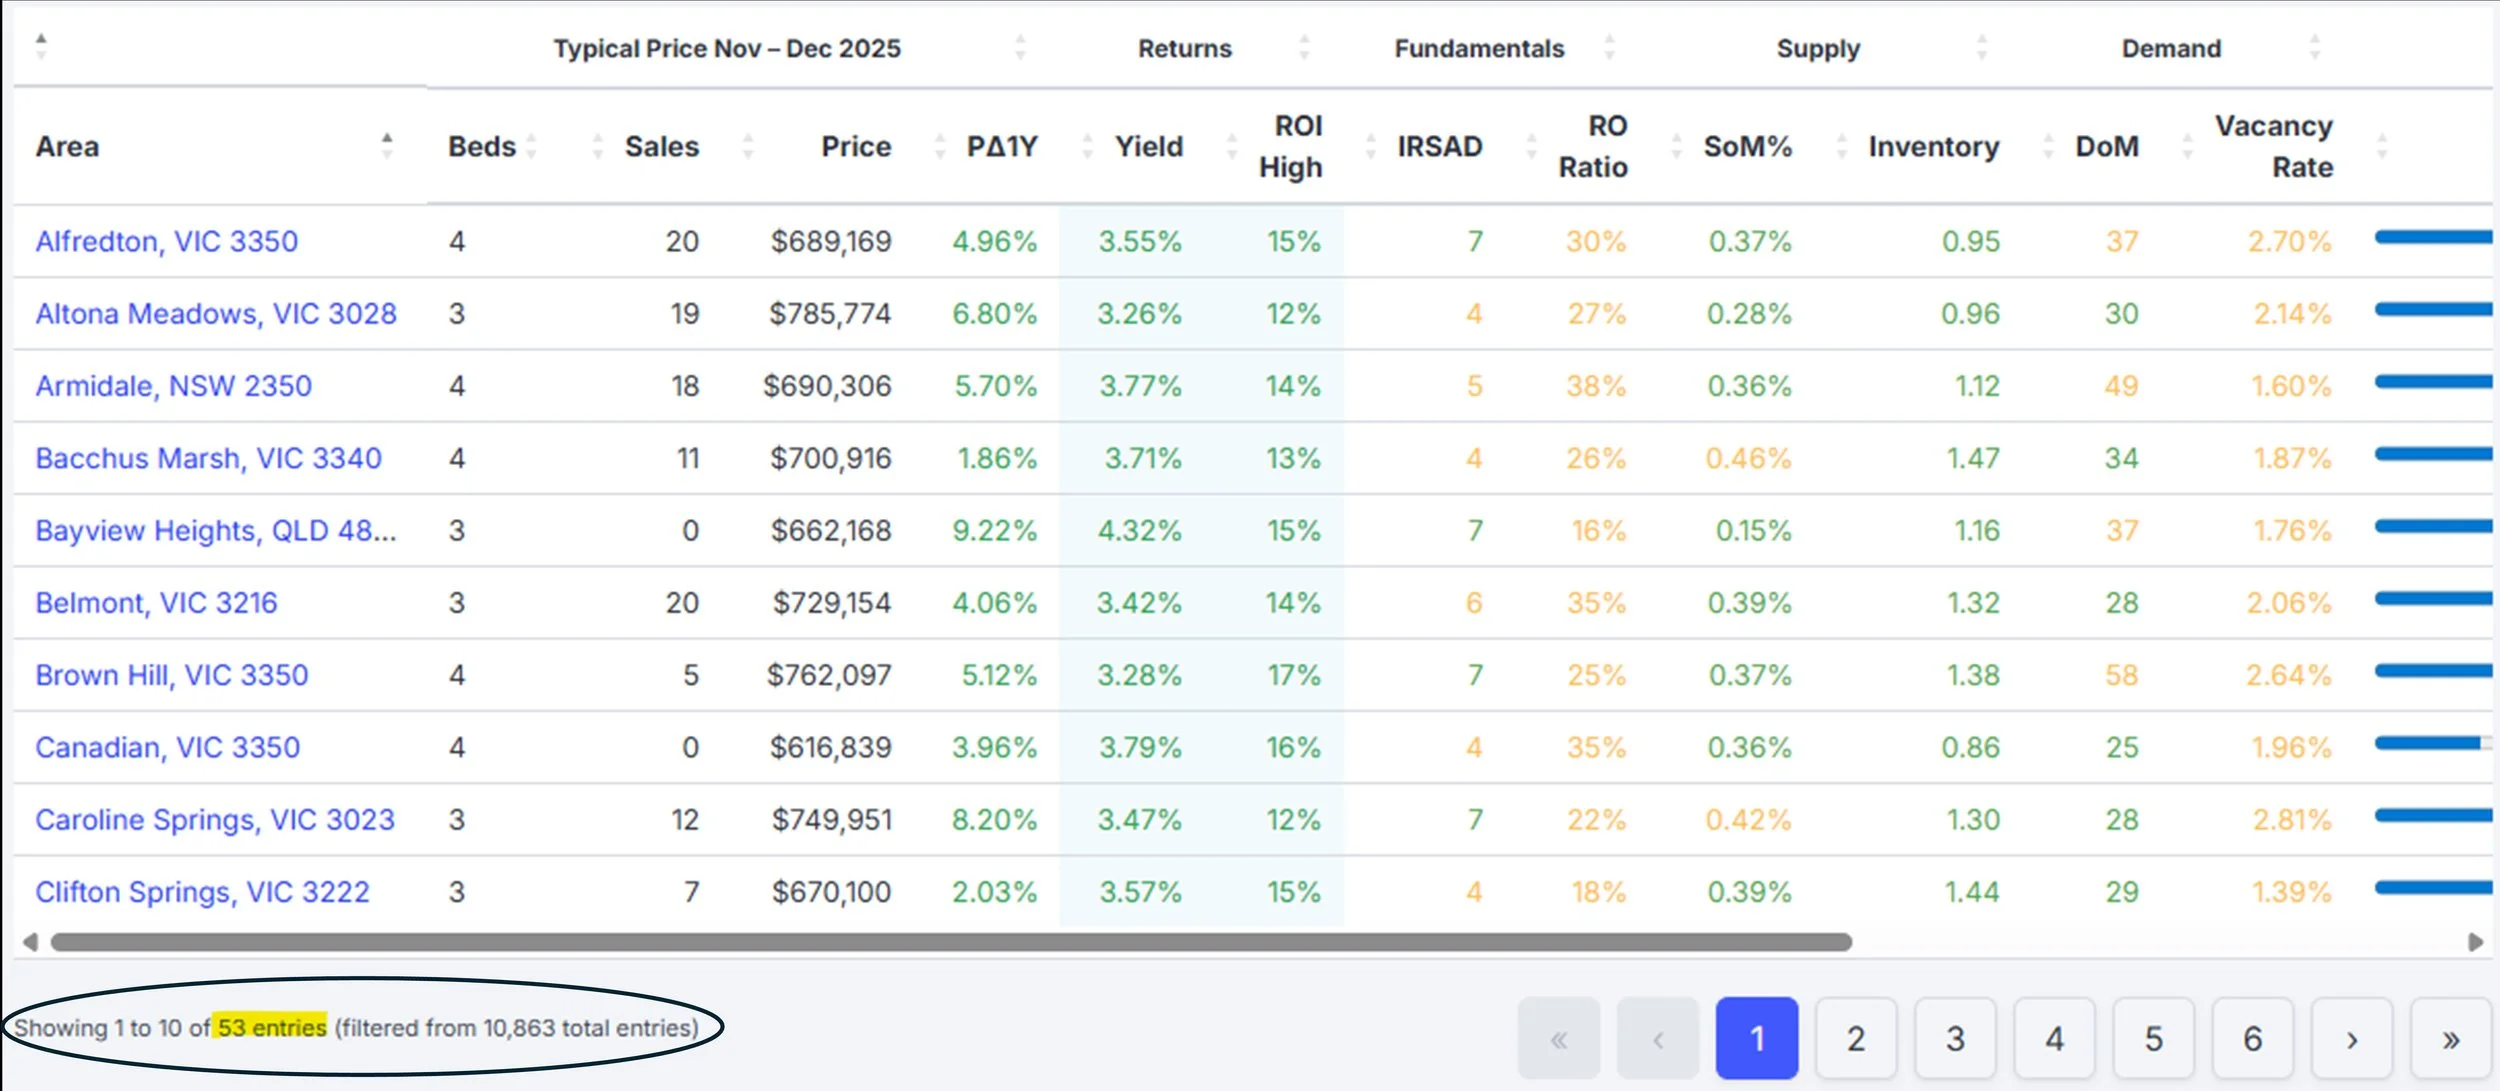
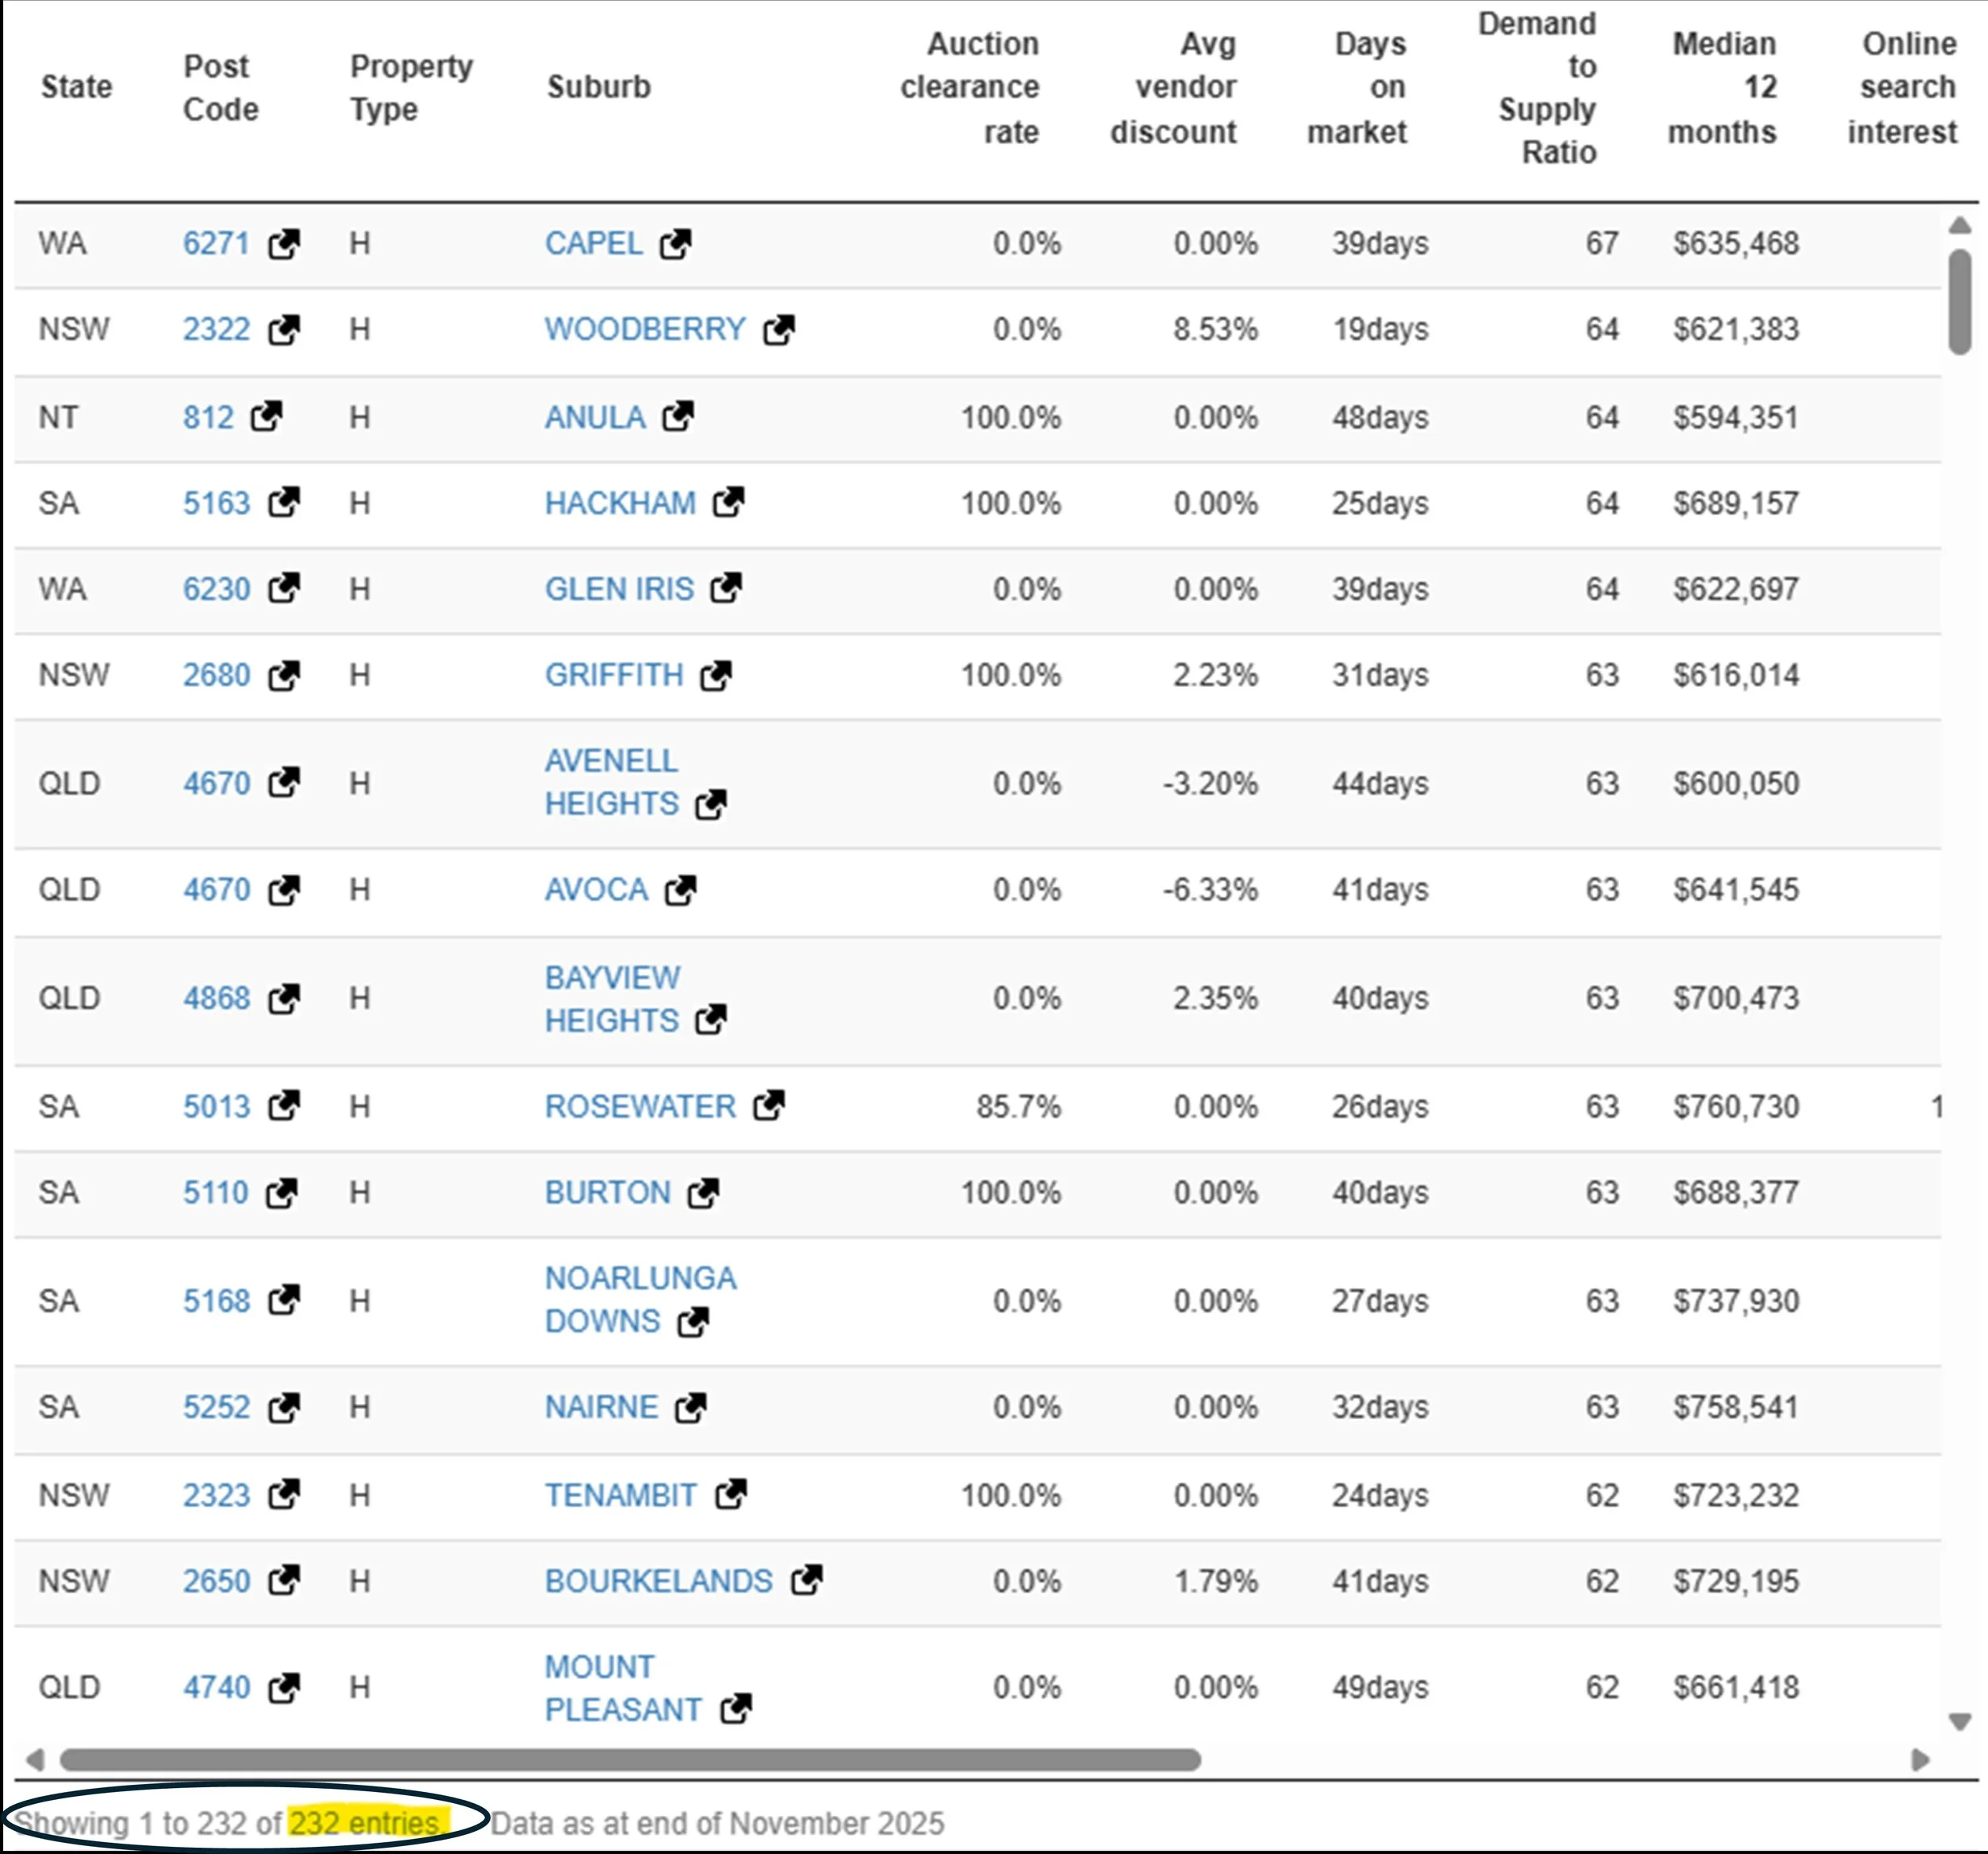
As you can see from the above, we were able to filter from the 15,00 suburbs in Australia all the way down to 53 for HtAG and 232 for DSR within the matter of minutes. Re-read that sentence. That is the power of these paid sources and why I suggest you use them.
Now there is a lot more you need to do before picking the suburb that is right for you to invest in, and in order to do that you need to first understand what these metrics are, how to analyse them and which are the most important - we which are about to over the next few pages…