Step 4 - Suburb Selection
Data Metric
3-year Typical Value Growth Rate
The amount of growth that properties prices have experienced in the area over the past three years expressed as a percentage.
10-year Typical Value Growth Rate
The amount of growth that properties prices have experienced in the area over the past ten years expressed as a percentage.
1-year Typical Value Growth Rate
The amount of growth that properties prices have experienced in the area over the past year expressed as a percentage.
Source
Paid: all platforms I mentioned before
Free: onthehouse.com.au, SQM research
Paid: all platforms I mentioned before
Free: onthehouse.com.au
Paid: all platforms I mentioned before
Free: onthehouse.com.au, SQM research
Target Range
Less than 50%.
If you want to capture the most amount of growth in a cycle, ideally the lower the % growth the better; even negative growth is suitable if there has been some growth in past 12 months and the supply / demand metrics are looking strong.
Less than 100%
Note: if you prefer to work in average annnual growth rates - this is the same as less than 7% (i.e. the national average)
Trend Analysis and Guidance
No trend analysis is required here.
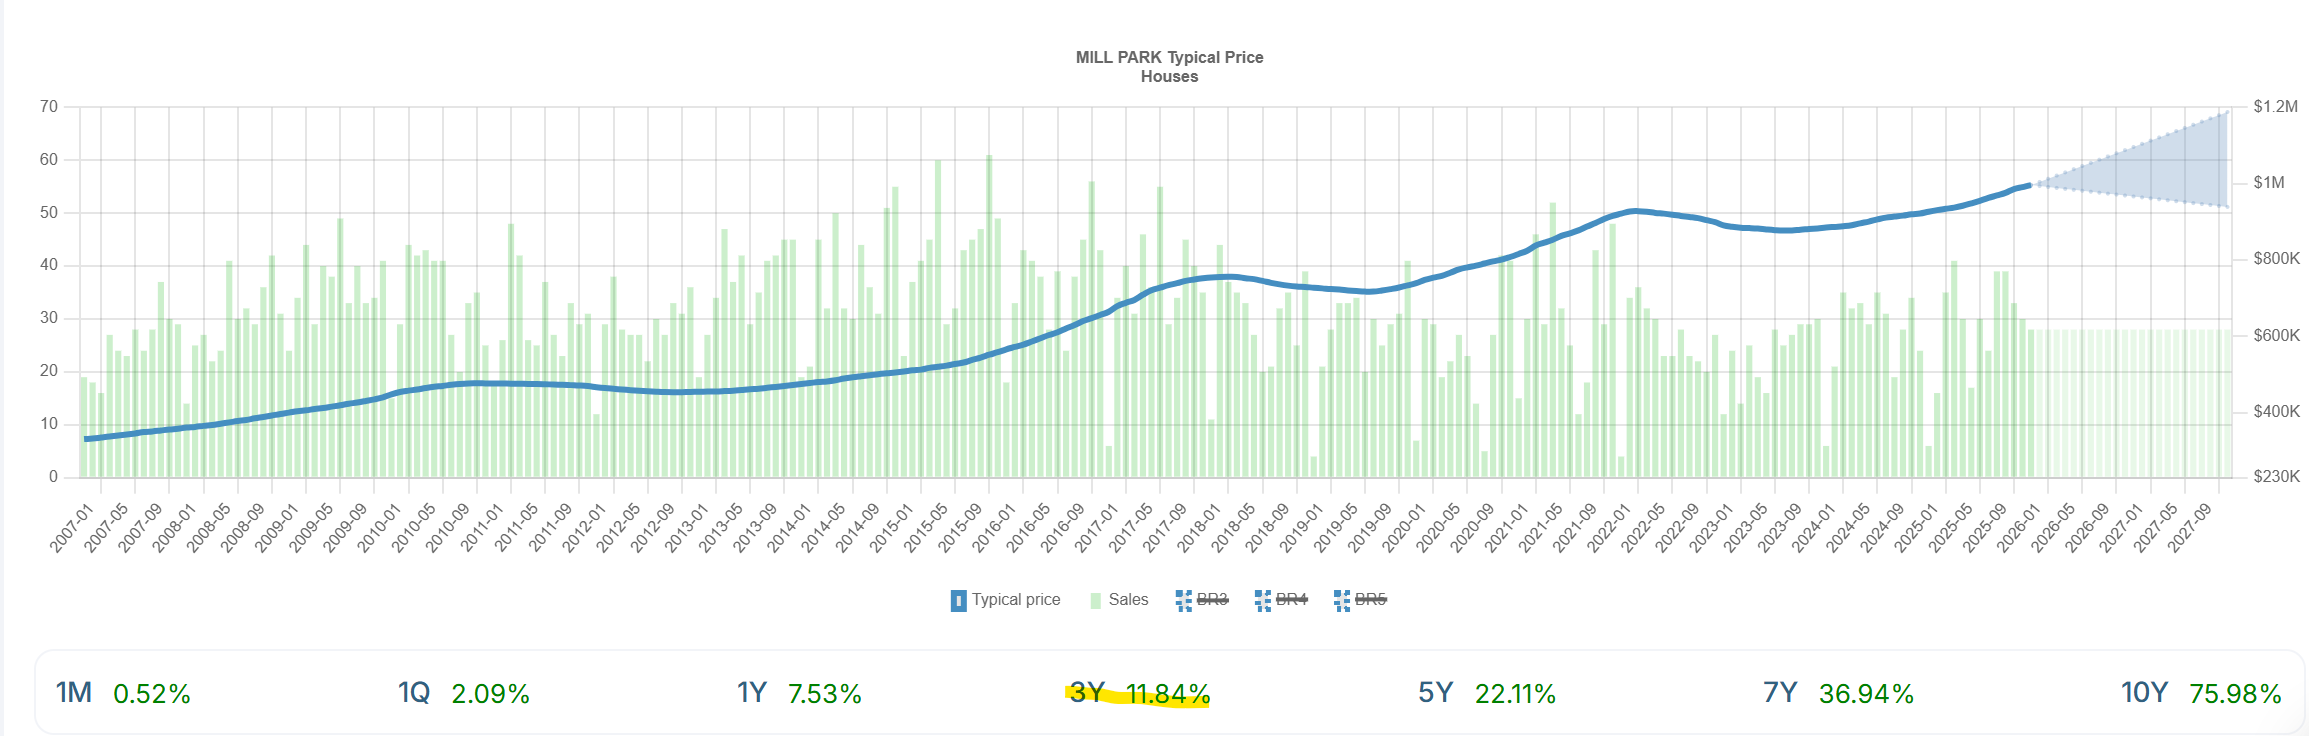
Here is a good example of a suburb (Mill Park, VIC) that has less than 50% growth over the past three years - see the yellow highlight.
Please also note the 5-year and 7-year growth rates are also low - which is a great sign.
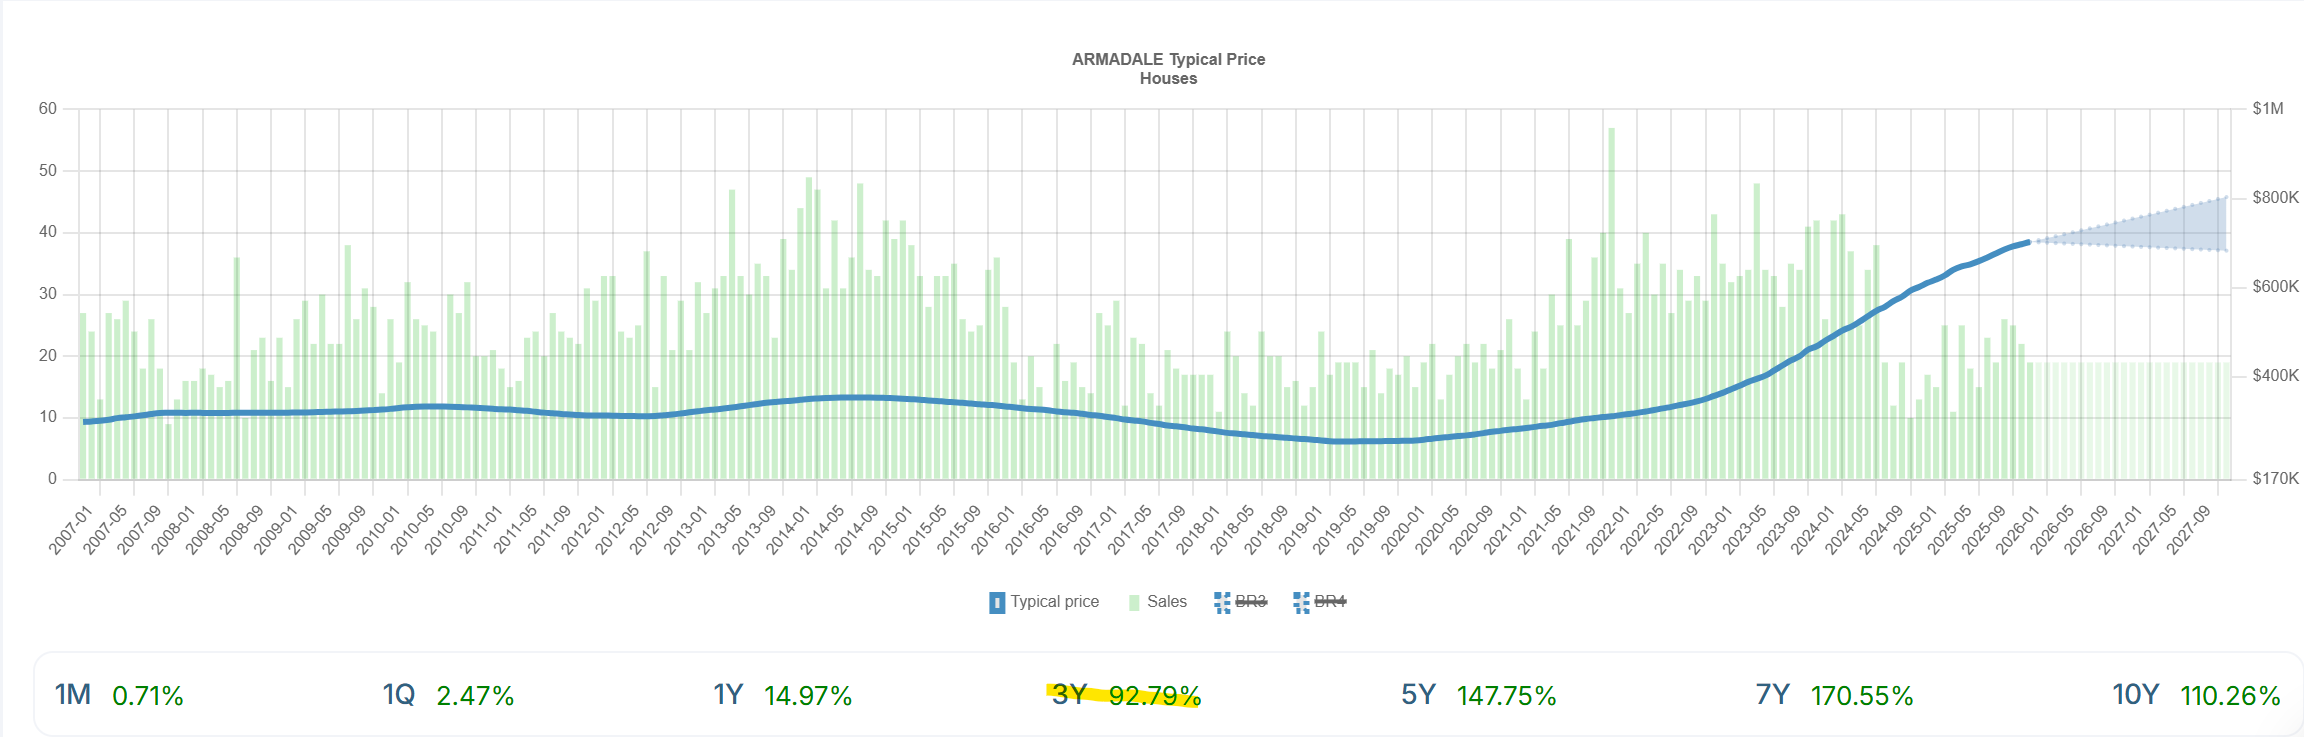
Here is an example of a suburb which has grown far more than 50% over the past three years (Armadale, WA) and therefore would not have good market cycle timing - see the yellow highlight.
Again, also look at the 5-year and 7-year growth rates which are extremely high - this is a bad sign and shows that the market cycle timing is not ideal.
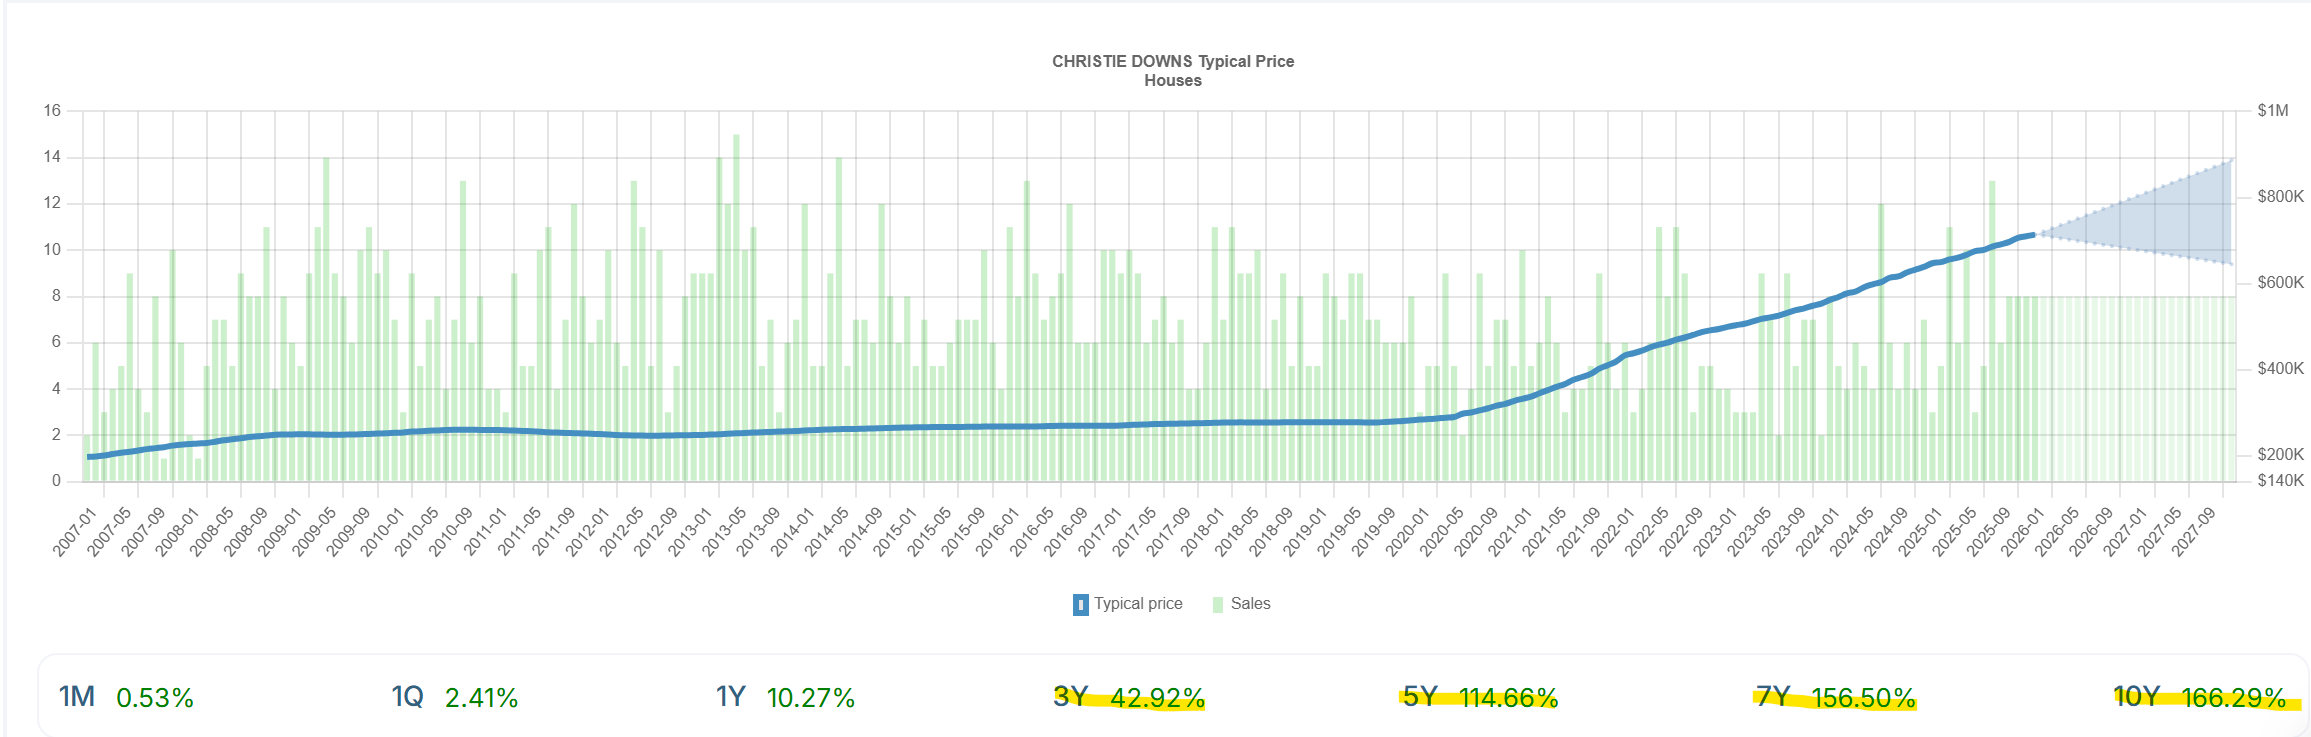
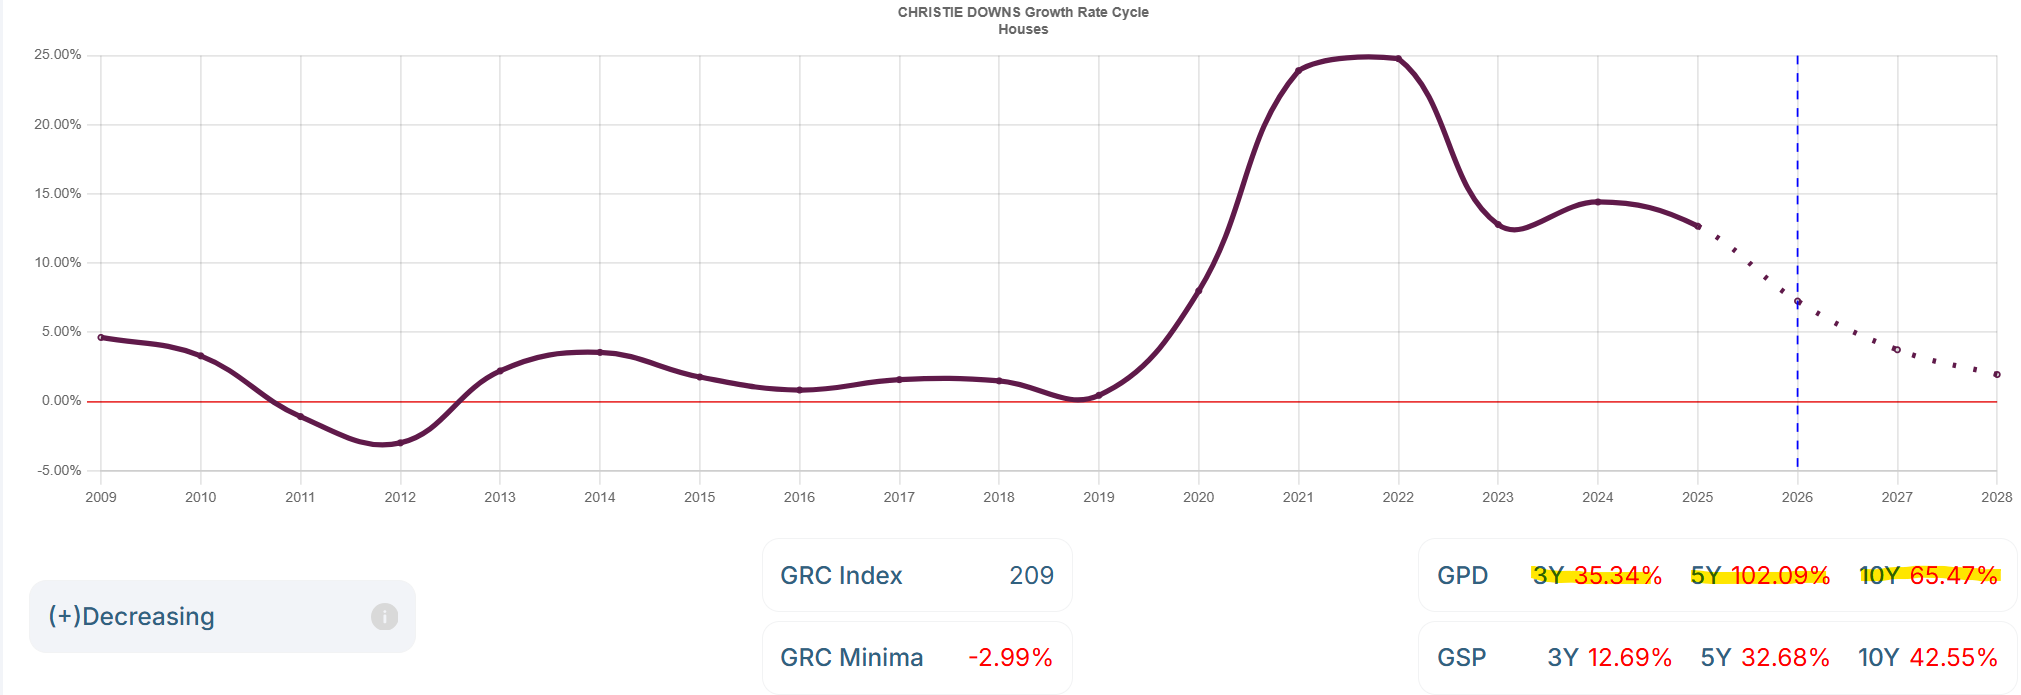
Here is an example of a suburb which has grown less than 50% (Christie Downs, SA), which is technically within our target range, but given it has grown so much over the past 5-years, 7-years and 10-years the market timing is actually very bad and therefore this suburb should be ignored.
No trend analysis is required here.
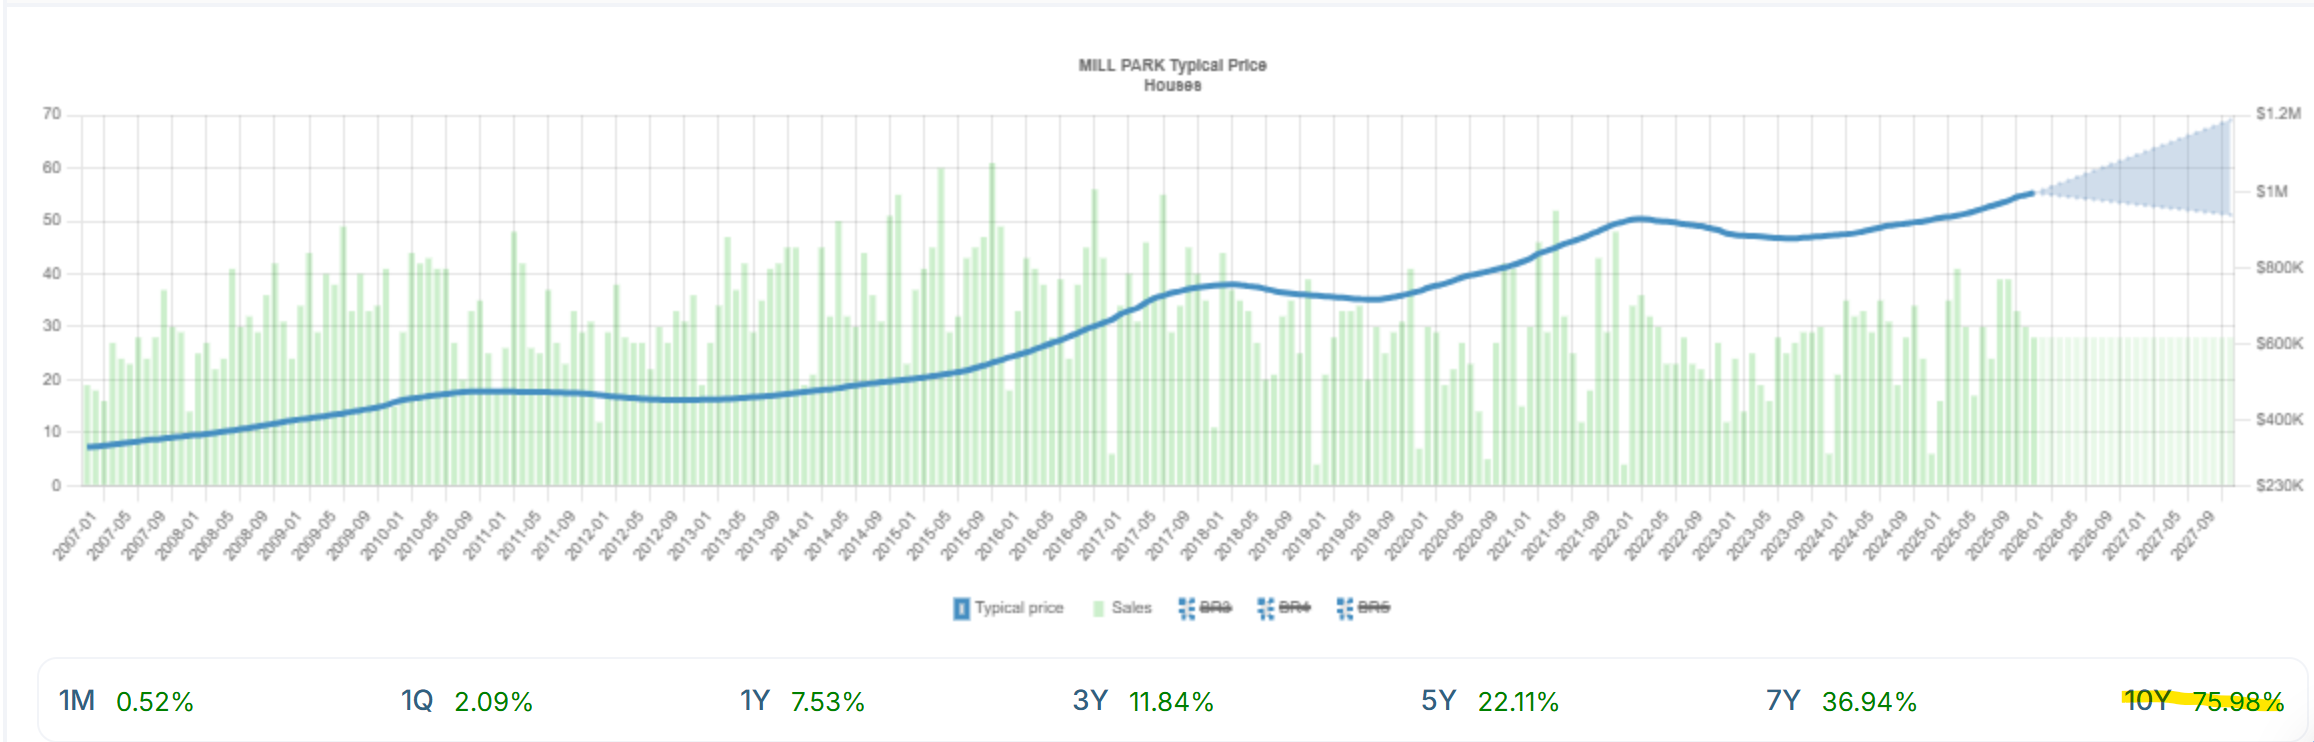
Here is a good example of a suburb (Mill Park, VIC) that has less than 100% over the past ten years - see the yellow highlight.
As mentioned above, given the 5-year, 7-year and 3-year growth rates are also quite low, the market cycle timing in this suburb is a good example of a very promising opportunity (provided the supply and demand metrics are also good of course…).
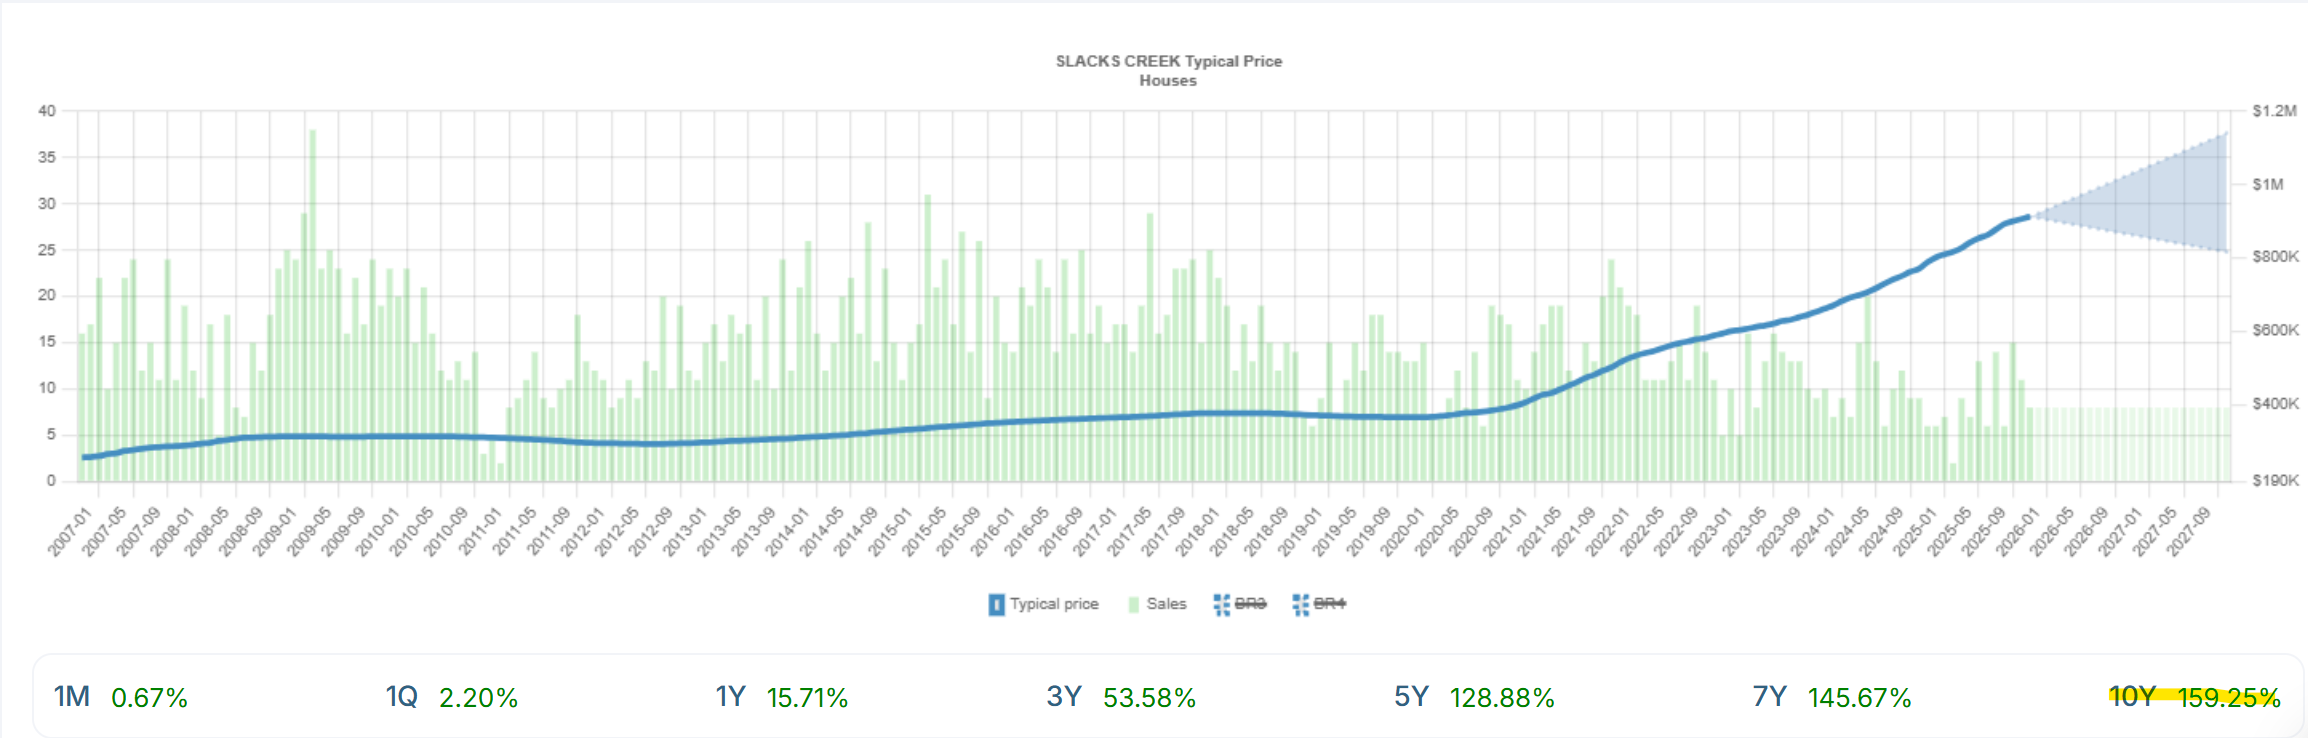
Here is an example of a suburb which has grown far more than 100% over the past ten years (Slacks Creek, QLD) and therefore would not have good market cycle timing - see the yellow highlight.
As you can see, the 3-year, 5-year and 7-year growth rates are also very high - meaning the market cycle timing in this suburb is an example of a bad time to enter the market.
Similiar to the 3-year growth rate, it is important to consider the 10-year growth rate in the context of the 5-year, 7-year and 3-year growth rates as this will give you some guidance on how flexible you can be with the target range.
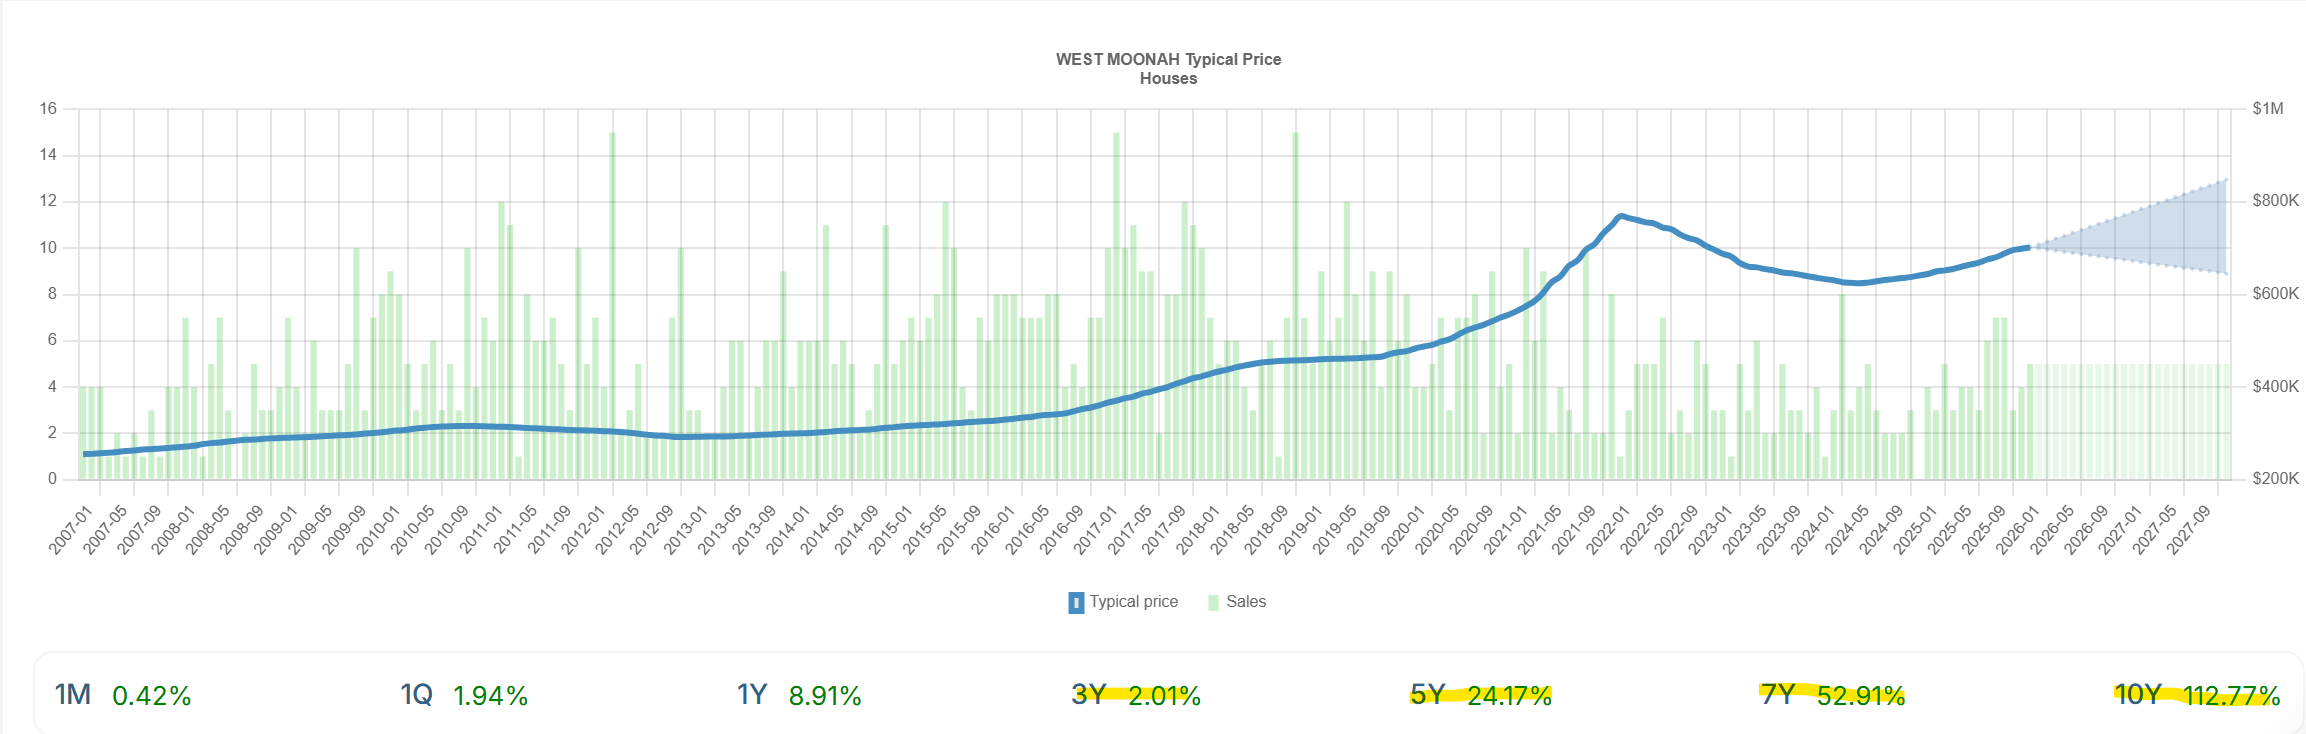
For example, the below suburb (West Moonah, TAS) has grown over 100% in the past 10 years; however, its 3-year, 5-year and 7-year growth rates are low, meaning that provided the supply and demand metrics are strong then you can still consider a market like this as it may soon experience a “second surge”.
Flexibility
Low
Market cycle timing is extremely important as it ensures that we are investing our money in the most efficient and effective way possible by increasing our chances of experiencing an entire growth cycle, not just a few years or months.
If you are looking for some quick equity growth, you may be able to flex this to anything below 60% but I generally don’t invest in anything above that - irrespective of the strategy.
Medium
You may want to flex this a bit to around 120% if the 3-year, 5-year and 7-year growth is low and the supply and demand factors are very strong.
Medium - High
This metric is highly specifc your brief, specifically when you want to extract equity, and how comfortable you are in negotiating in hotter market conditions.
Rationale
High growth over the last 3 years could mean that the majority of the growth in the cycle has passed and the market is potentially nearing its peak.
For the record, this doesn’t mean the area will stop growing, it just means there is a good chance that you have missed a large chunk of the growth from this cycle and therefore it may be more efficient to invest elsewhere.
Just to be very clear here, you need to consider this number in combination with 5-year, 7-year and 10-year growth rates. For example, if it has grown 70%+ in 5 years but less than 50% in 3 years that is still bad market timing.
Please see the myth-busting section of Step 4 where we talk about how high historical growth rates are a red flag.
We need to see at least some positive price movement in the long-term in order to ensure that prices are trending in the right direction.
No trend analysis required here
If you are looking at an area with very low 1-year growth (i.e. near 0%) then you should also check to see if there has been some further positive growth in the past 3 - 6 months.
If you want to get equity as soon as possible and are ok with purchasing under more difficult conditions, then markets which have recieved 10%+ growth may be more suited to you as it is more likely that you may see strong growth in the short-term (i.e. within 1 year).
However, if you would prefer to try enter as close to the bottom of the cycle as possible and ride the whole wave of the growth cycle - which could result in you extracting equity slightly later (but not always the case), such as between years 1 - 3, then markets which haven’t yet exceed 10%+ growth a year may be more suited.
Mill Park, VIC
Bonus tip for HtAG users
If you end up subscribing to HtAG you will get access to a few really useful metrics which will look at the growth cycle of suburbs, one of those is “GPD” or “Growth Pattern Deviation”.
Rather than trying to explain this myself, here is what HtAG defines this metric as:
“Growth Pattern Deviation measures the difference between recent price growth (over the past 3, 5 and 10 years) and the long-term historical average growth for each of those periods…In essence, it shows how much current growth patterns deviated - either above or below - from what has typically occured in the past.”
In other words, this metric will tell you whether a suburb is overperforming or underperforming its 3-year, 5-year and 10-year historical averages - which is very important information when assessing market cycle timing, in fact its very similiar to what we are doing above with the above metrics. So this can be a really useful “double-check” to use to make sure that our above market cycle timing is accurate (or it can even replace the above method if you’d prefer).
We want the GPD to be a negative % for each of the 3-year, 5-year and 10-year period, as this means it is underperforming its long-term averages over those periods - meaning the market cycle timing is looking good.
If it is a postive %, then this mean it has been overperforming its long-term averages over those periods - meaning the market cycle timing is not looking good.
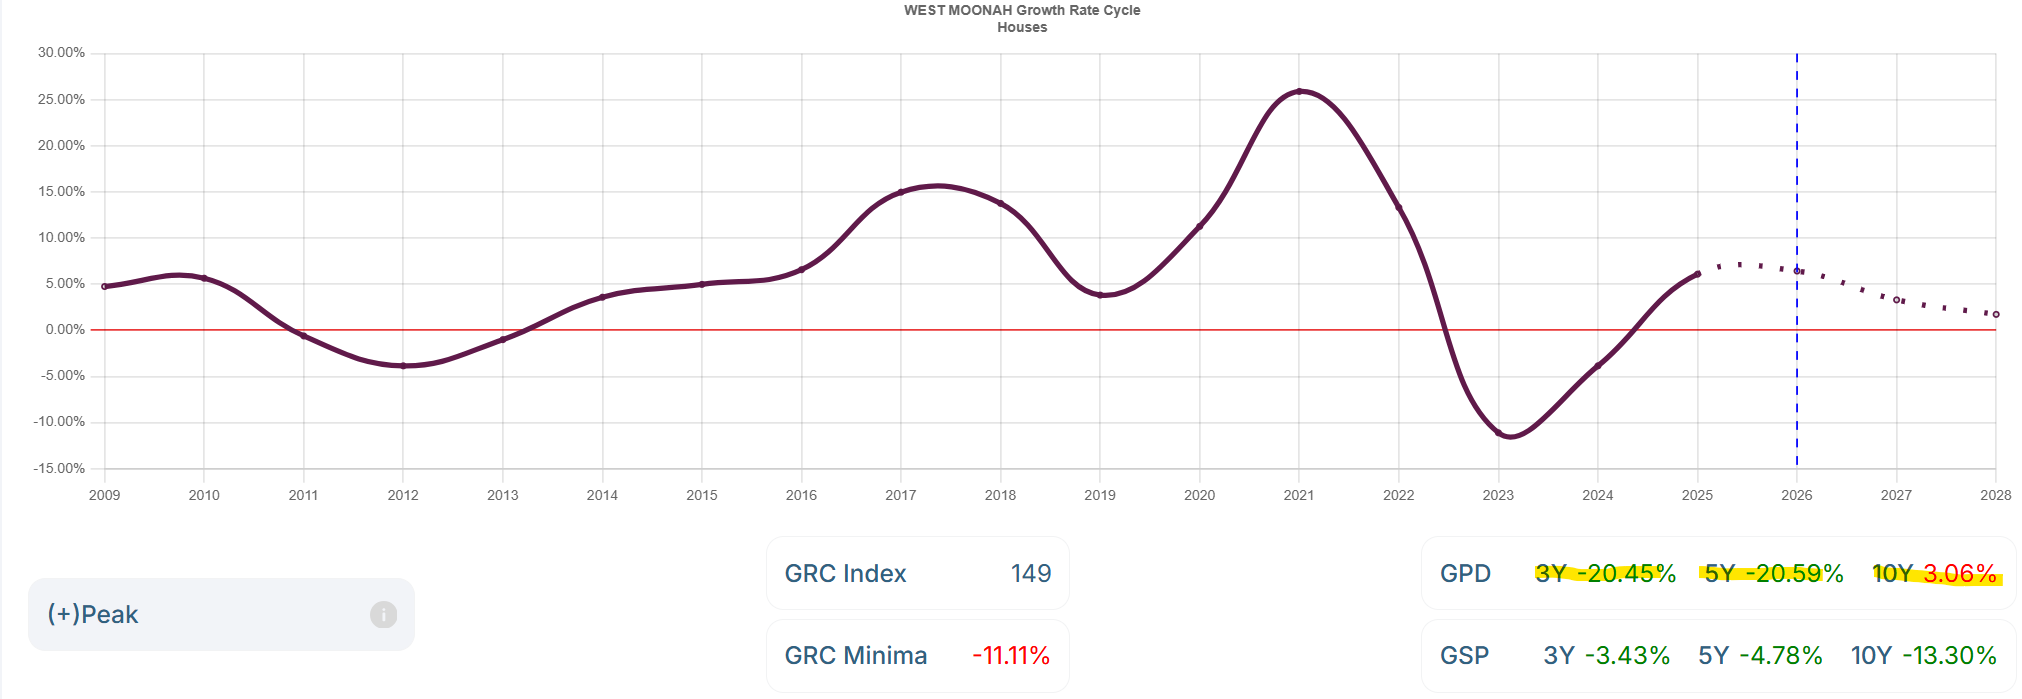
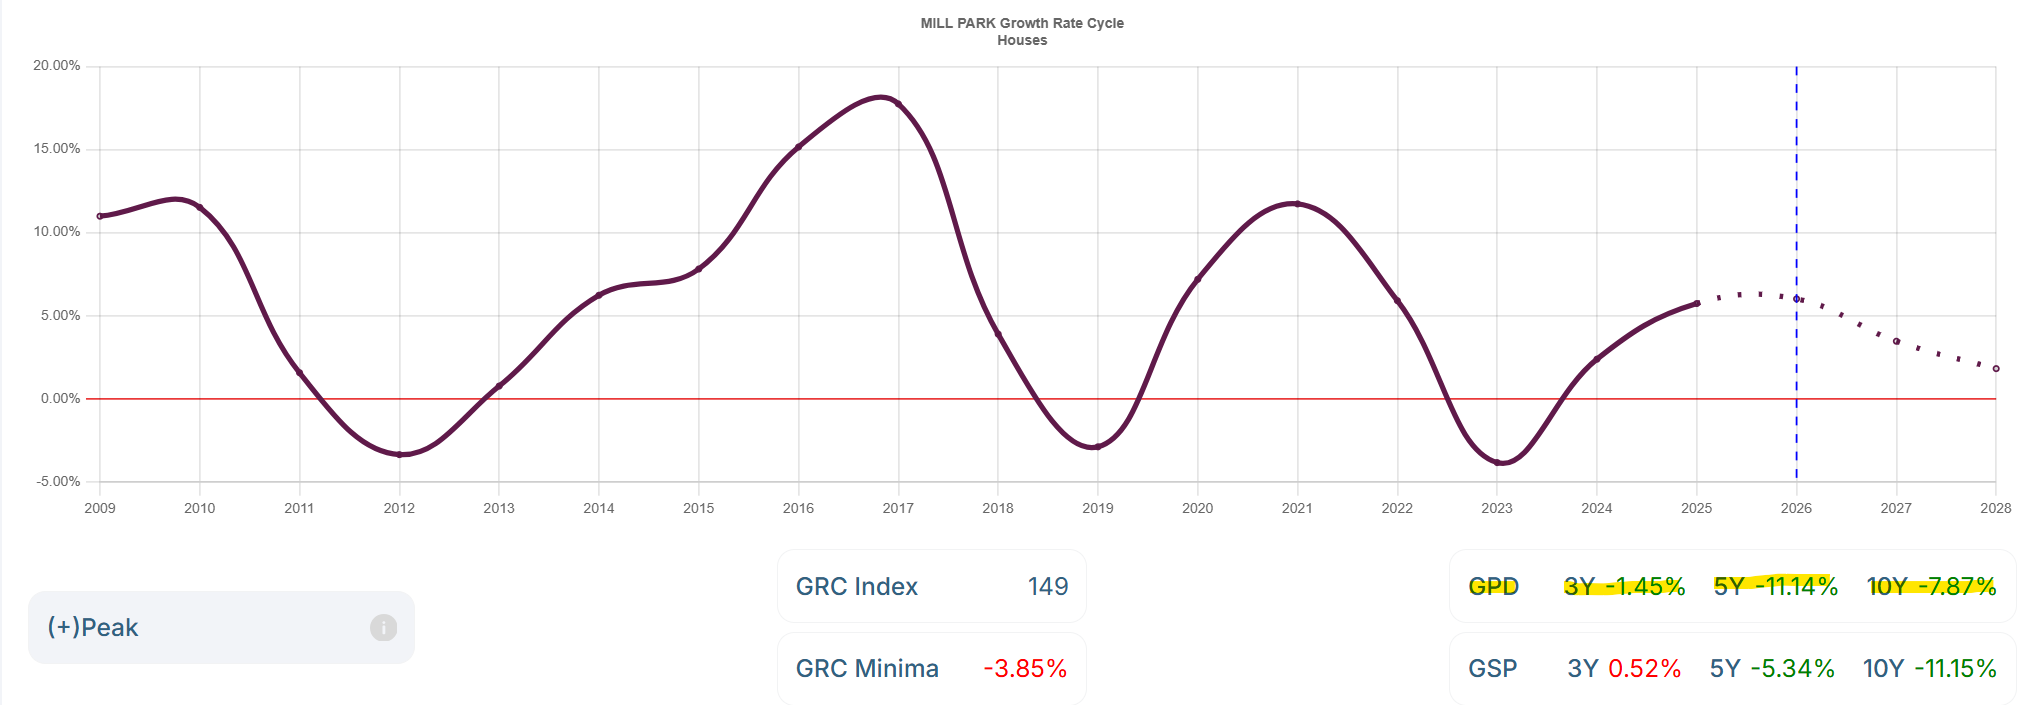
Let me show you some examples using some of the suburbs I have mentioned above.
As you can see, the 3Y, 5Y and 10Y numbers are negative, meaning that this suburb has been underperforming its long-term averages, and this also aligns with our market cycle analysis based on the above typical value / median price growth percentages.
As you can see, the 3Y, 5Y and 10Y numbers are positive, meaning that this suburb has been overperforming its long-term averages, and this also aligns with our market cycle analysis based on the above typical value / median price growth percentages.
As you can see, the 3Y, 5Y are negative, meaning that this suburb has been underperforming its long-term averages over the past 3 and 5 years; however, the 10Y value is slightly positive, meaning that over the past 10 years the suburb has slightly overperformed its long-term 10 year average. This also aligns with our market cycle analysis based on the above typical value / median price growth percentages.
Christie Downs, SA
If you want to buy in warm markets: 0% - 10%
If you want to buy in hotter markets: 10%+
West Moonah, TAS