Step 1 - Understanding the Fundamentals
Ok so now you know that the aim of property investing is to achieve capital growth - but what actually causes a property to increase in value?
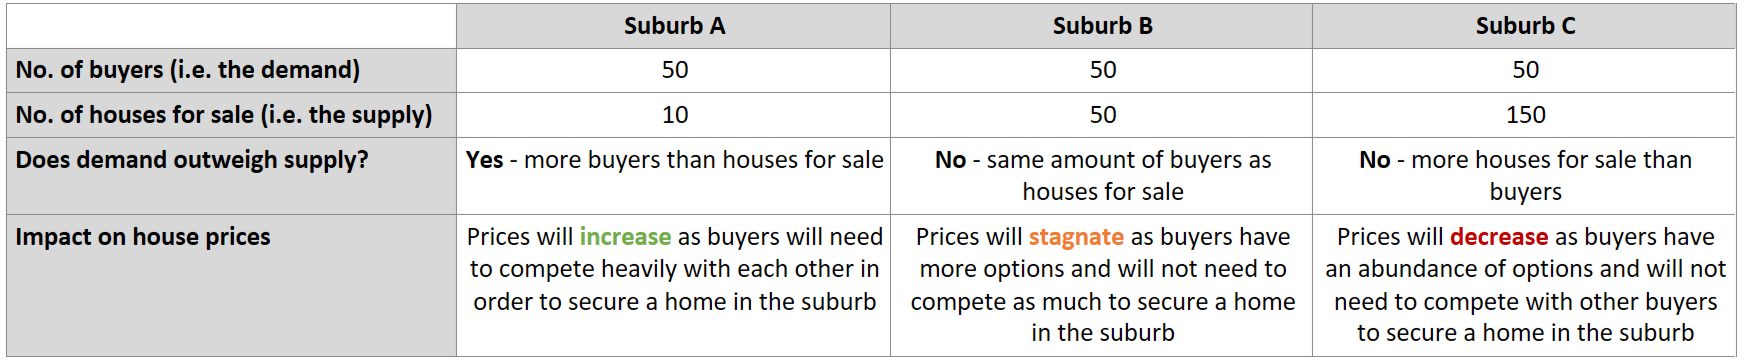
The answer to that question is actually quite simple: house prices in an area will increase when the demand from buyers is greater than the supply of houses.
Understanding the relationship between supply and demand is 'Economics 101' and it is the same for property investing. Apparently you learn about this stuff in high-school, but for those of you like me who didn't listen to your teacher graduated a while ago and need a refresher:
Supply: is the quantity of a good or service the market is willing and able to sell - i.e. how many properties are available for sale; and
Demand: is the quantity of a good or service the market is willing and able to buy - i.e. how many people want to buy the properties available for sale.
In theory, the amount of supply and demand of any good / service that exists in a market is supposed to push and pull against each other until they reach a 'balance point' (i.e. the amount of demand in the market is perfectly matched by the amount of supply) which then results in a stable price for the good / service. If this theory was strictly applied to the property market it would mean that in any given suburb within Australia for every buyer in that area there would be an available home for sale, and as the amount of buyers increase / decrease the amount of homes available for sale in the area would also increase / decrease by the same amount.
However, this is just theory for a reason, because in reality there are various factors which impact the supply and demand of homes in the property market which means that in specific suburbs at specific times there will be an imbalance between supply and demand which will put downward or upward pressure on house prices in that area.
In case everything I have said above just sounds like gibberish, let me give you an example:
Ok if that STILL doesn’t make sense, I give up.
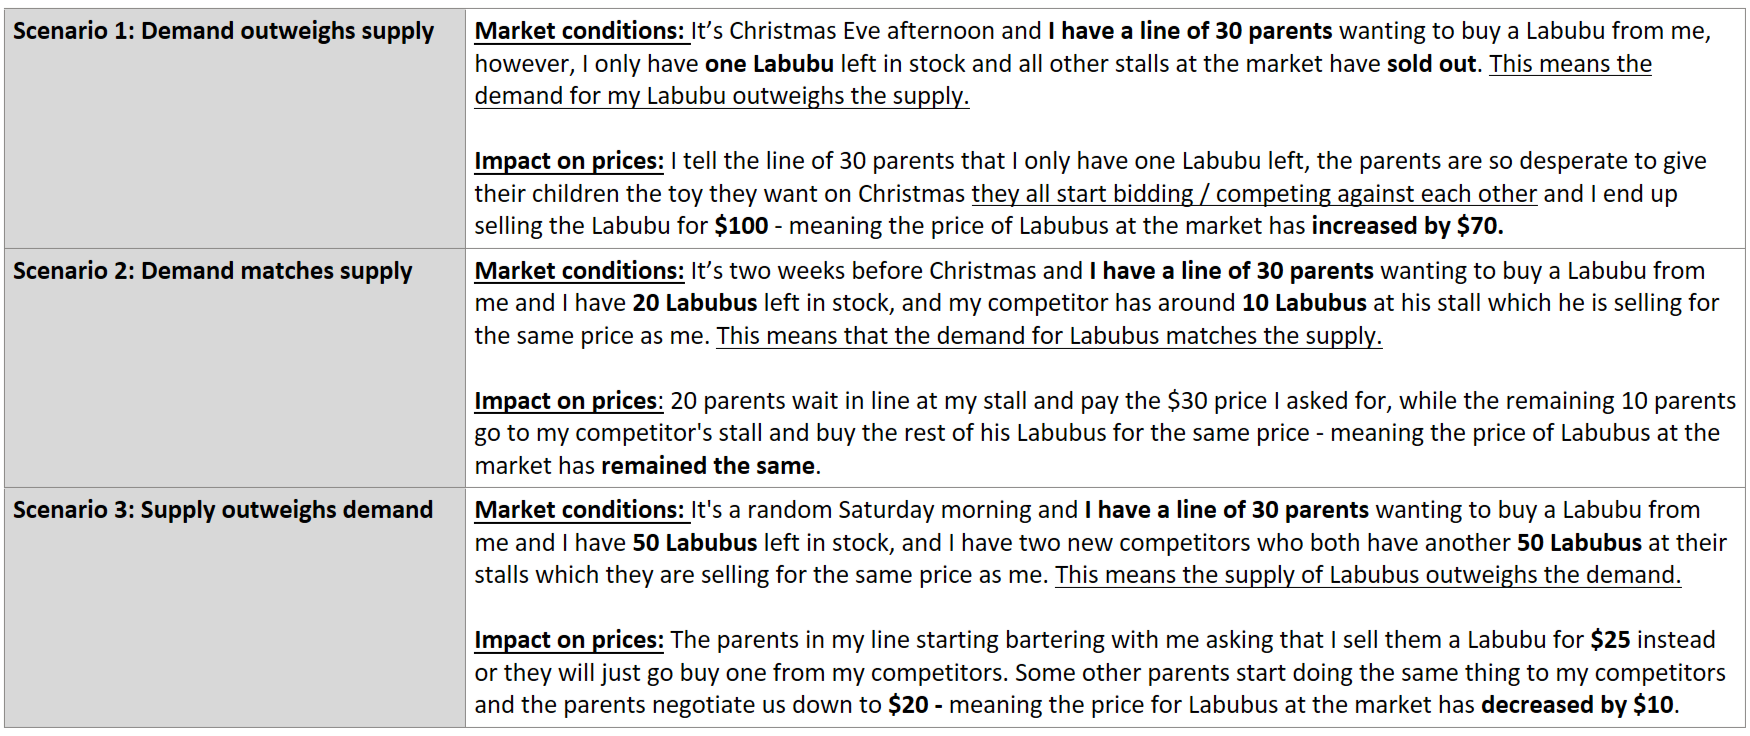
Just kidding - let me try one more example that does not involve houses: instead let's say that I am running a stall at the local markets and I am selling this new toy, called a 'Labubu' (if you know you know), for $30 each:
In case it is helpful to see a real life example - take a look at the below chart which tracks the following data metrics in the suburb of Kelso, QLD over the past few years:
Stock on market - i.e. the amount of houses for sale in the suburb, the lower the better. This is a supply metric and is reflected in the blue line.
Days on market - i.e. how quickly houses sell in the suburb, the lower the better. This is a demand metric and is reflected in the red line.
Median house value - this is reflected in the green line.
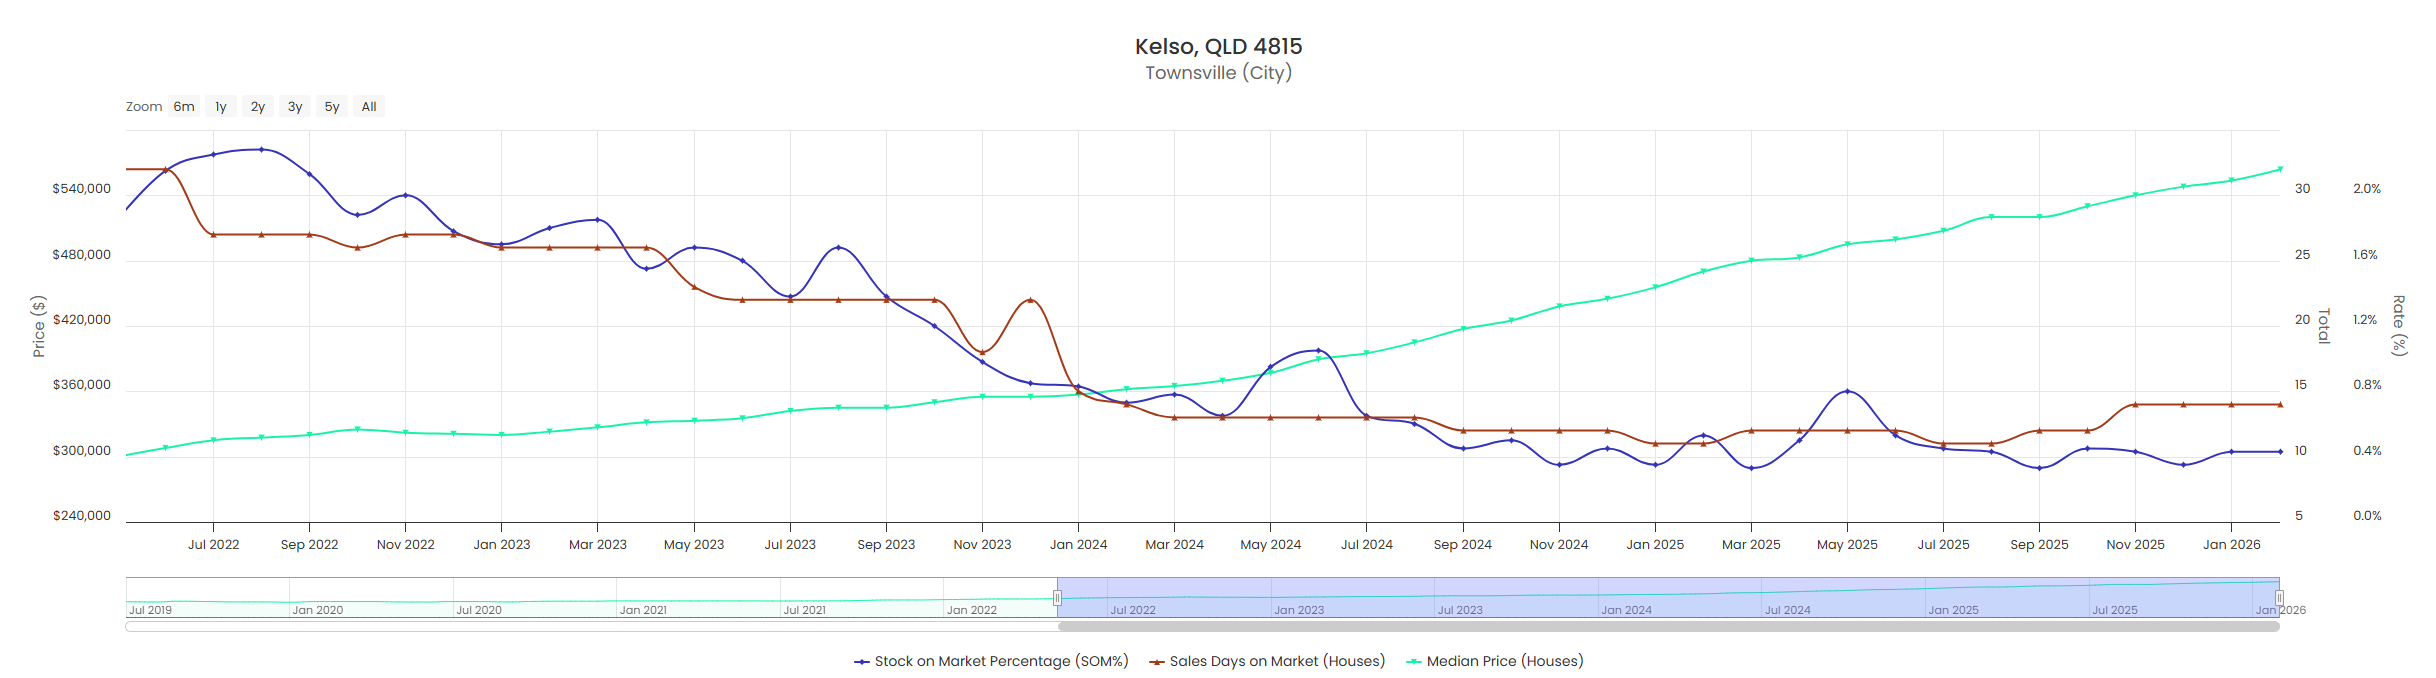
As you can see, as the demand and supply (i.e. the red and blue lines) trend downwards, meaning the supply is decreasing and the demand is increasing, the median price in the suburb (i.e. the green line) trends upwards.
This is particularly clear when you look at the starting position of all the lines at the start of the graph in July 2022 and at the end of the graph in January 2026 - the demand and supply were at their highest at the beginning, and prices were at their lowest; however, at the end of the graph the demand and supply were at (or near) their lowest and prices are at their highest.
What factors influence the supply and demand imbalance?
Now that you understand the impact of supply and demand imbalances, it is also important to understand what factors can create these imbalances - I have outlined some of these in the table below. Please note that the below are mostly macro factors which are foundational for your understanding of property market dynamics in Australia, we will look into the specific supply / demand metrics at a suburb-level elsewhere in this website at Step 4 (Suburb Selection).
Supply Factors
Construction costs:
Impact: Approx. 96% of housing construction in Australia is undertaken by the private sector, therefore Australia's housing supply is deeply linked to the affordability of residential housing developments.
This means that when construction costs rise developers either pass these costs on to buyers to maintain their profit margins which increases house prices, or they may decide the project is financially unviable and do not build any homes, which limits the amount of supply in the market also increasing house prices.
This is particularly true for the affordable housing market, because as construction costs rise most developers move to focus on more luxury-type developments due to the higher margins.
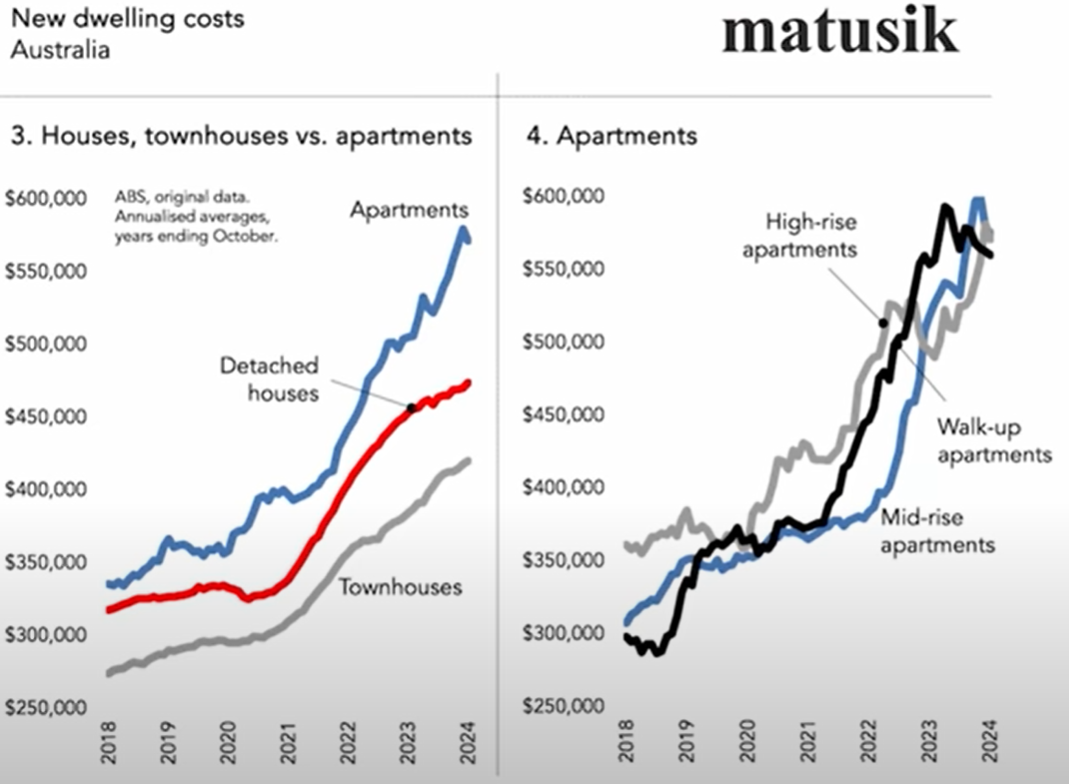
Current Macro Conditions (2026): Construction costs have surged over recent years, in particular between 2022 and mid-2023 where they increased 8-12% annually. For the visual learners in the class, the below graph from Matusik clearly illustrates this sharp rise in costs. This has been a direct contributor to the sharp decrease in dwelling completions and approvals across Australia in recent years, which I will touch on below.
Availability of construction workers:
Impact: Strongly related to construction costs is the availability of skilled labor - i.e. the people who will actually build the houses. If there is a shortage of skilled workers this causes delay to the completion of homes and it means the existing workers are in such high demand that they can increase their costs significantly which results in (yep you guessed it) less houses being built.
Current Macro Conditions (2026): Australia is estimated to be short 130,000 - 370,000 construction workers if it wants to meet its National Housing Accord target of 1.2 million homes by mid-2029 (which is extremely unrealistic ambitious - I'll touch on this a bit more below in 'Development Approvals').
There are various reasons for this shortage, including visa constraints, ageing workforce and low attractiveness of the industry to young workers (apprenticeship completions are down 15% and enrolments are down 22%); however, a major contributing factor is the competition from major infrastructure projects which is diverting workers away from residential construction.
This is not helped by the fact that construction insolvencies have continued to worsen in recent years, meaning there are less and less construction companies to build housing stock and increase competition in the industry to reduce costs.
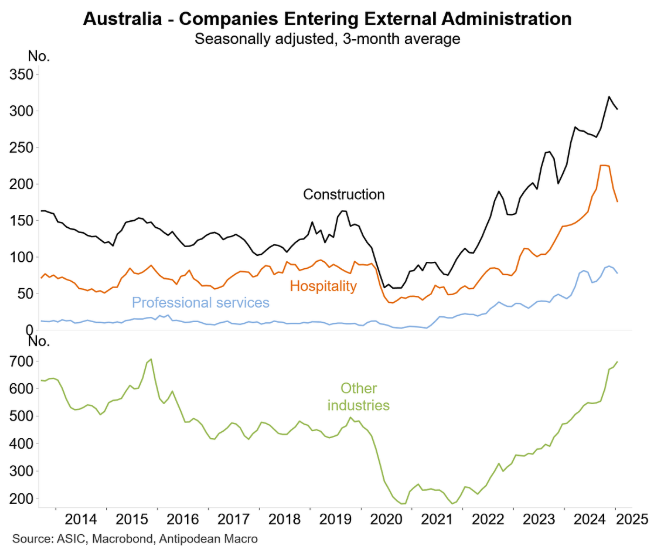
As a result, wages for trades are up anywhere from 20% - 40% since 2020, in the same time in which productivity of the residential construction trade has decreased 12%. Great time to be in a trade for anyone on the fence!
Zoning:
Impact: Zoning is crucial to understand as a property investor as it determines how land can be used in a specific area. For example, Most suburbs in Australia are zoned as low-density residential - meaning just single houses can be built on the land. Therefore, this limits the amount of new supply that can be introduced into that area.
However, some areas are zoned to allow medium density developments (i.e. townhouses and duplexes) and high-density apartment blocks - which may provide some upside from a development perspective but it can also significantly increase the amount of housing supply in an area and therefore put downward pressure on price-growth.
It is important to note zoning regulations are different in each council around Australia and suburbs can be re-zoned over time to allow for more housing supply to be introduced. Therefore, as a property investor it is important to stay abreast of any zoning changes that may occur in suburbs you are looking to purchase or have already purchased in.
Current Macro Conditions (2026): With the rise of NIMBYism ('Not in my backyard') in recent years, proposals to re-zone certain suburbs to allow for higher density residential construction has been met with strong resistance. However, with the inability (or incompetence) of local governments to deal with the housing needs of their communities many state governments are now overruling local governments and looking to introduce broad sweeping zoning reforms - this includes Sydney who has just led the largest rezoning program in history through its Transport Oriented Development Accelerated Precincts.
Development approvals:
Impact: A development approval (DA) is a formal permission from a local or state planning authority that allows a developer to carry out certain land use activities - such as subdividing land or constructing homes.
The more development approvals an area has the more supply of homes it is likely to receive. Therefore, if you want to ensure supply is lower than demand, you want to be investing in areas with very low development approvals.
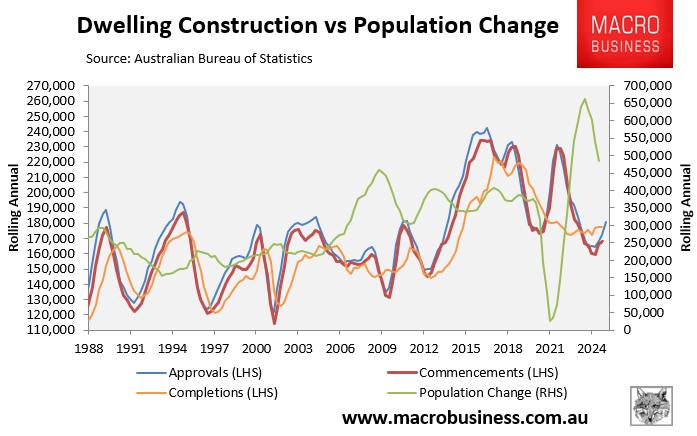
Current Macro Conditions (2026): Fortunately for investors (and unfortunately for the social fabric of our society and economy), the amount of development approvals for homes in Australia has been trending down dramatically since the peaks of 2020. Check out the below graph from MacroBusiness for context.
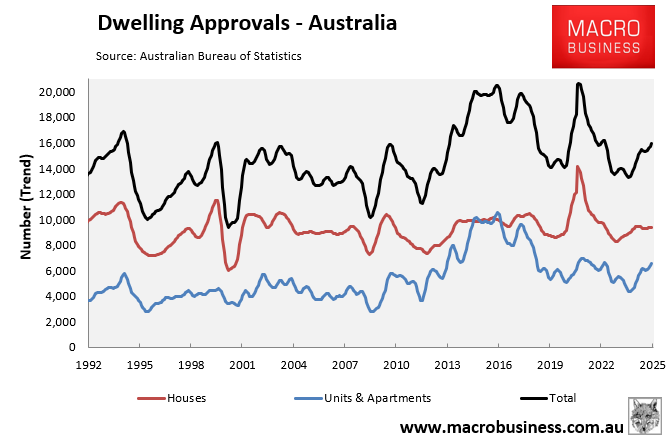
Now you may have noticed there has been a noticeable uptick in approvals over the past year; however, it is important to put this into context with respect to our projected levels of immigration as well as the Government's target to build 1.2 million homes over the next 4 or so years in order to address the supply issue.
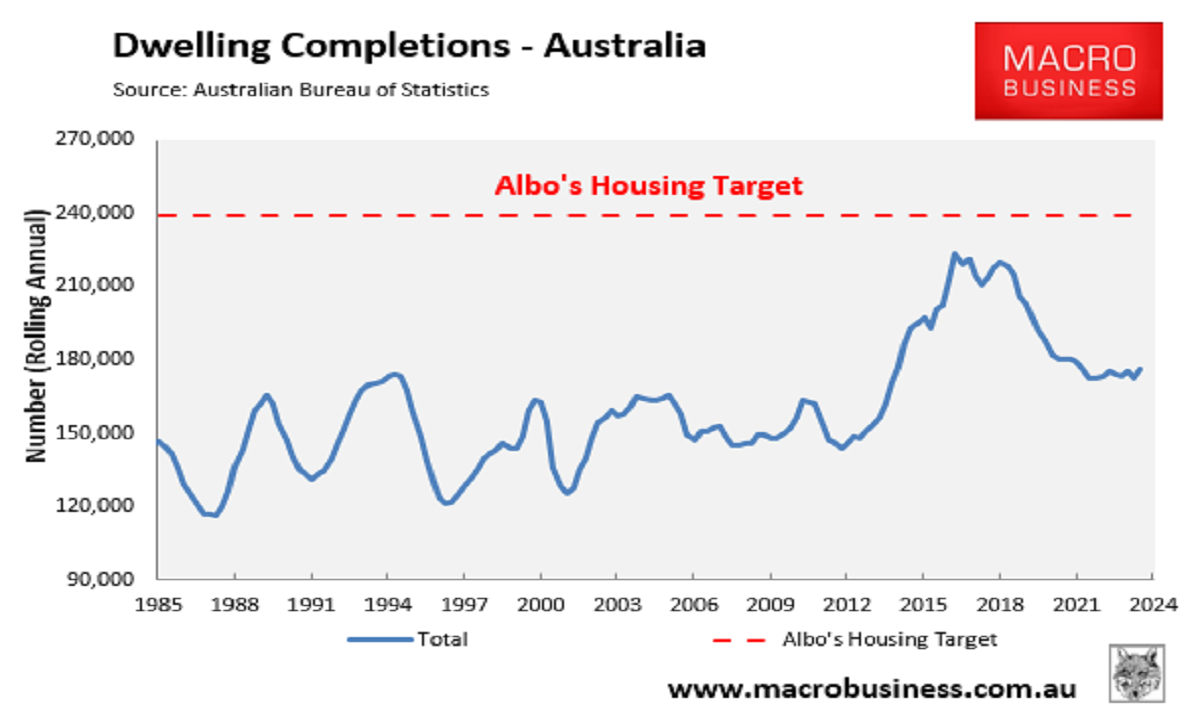
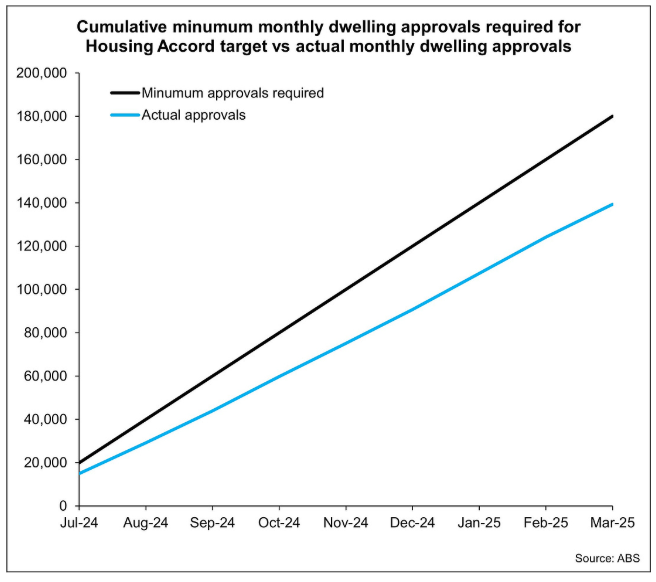
As you can see above from these two graphs - there are significantly less dwelling completions and approvals than needed in order to meet the target set by the Government. In fact, in order to meet this target we will need to consistently building over 240,000 homes a year - which is something Australia has never even achieved once in its entire history. You can see why I said this target is completely unrealistic, especially when you consider that the demand for housing won't be decreasing any time soon given our projected high-rates of immigration.
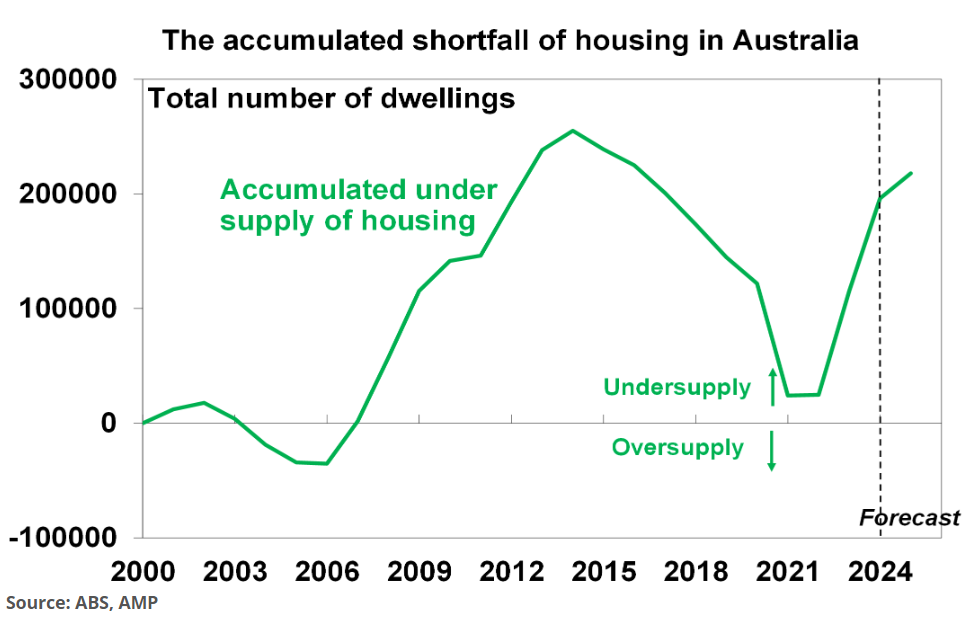
In case this isn’t clear enough, check-out the gap between the green line and the other lines in the graph below from MacroBusiness (at least it has improved slightly this year!).
What does this mean for house prices going forward? You guessed it - there is going to continue to be an undersupply of homes in (some areas) of Australia which most likely will result in an increase in prices. The sheer gravity of this undersupply is demonstrated in the below forecast from the ABS / AMP.
Land availability:
Impact: If the supply of homes needs to be lower than the demand in order for prices to grow, then it logically follows that the amount of developable land that is available in an area for new houses to be built on is an important supply-side consideration. I think this is best illustrated visually - below you will see two pictures from suburbs located in Melbourne with one having an abundance of vacant and developable land for new homes to be built and the other having basically none.
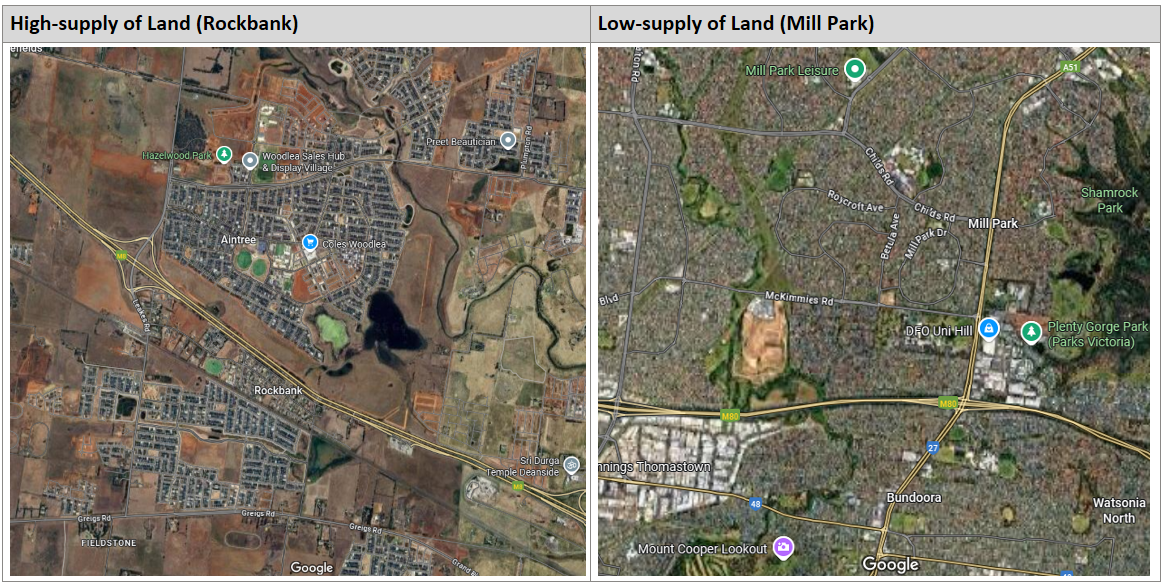
In a suburb like Mill Park there is essentially no more developable land, this means that as demand increases there is no possibility for new detached homes to be built in order to meet this demand. This encourages competition amongst buyers as there is a limited amount of homes to buy. The only way housing supply can be added to an infilled area like Mill Park is if they increase the density - i.e. build townhouses or apartments, which will ultimately increase the value of the existing parcels of land in the area due to the development potential or, if you have been reading carefully, may not be possible due to zoning restrictions.
However, if you are silly and invest in a suburb like Rockbank (which you won't because you are reading this website and are now much smarter than that) you are inviting the risk of new housing supply being introduced into the area as there is kilometers of vacant land for new homes to be built on to match any increased demand. This reduces competition amongst buyers because there is an increased amount of homes that they can purchase - meaning that they will not feel pressured to pay a higher price to secure a home as there may be another five about to be completed just a few streets over. This ultimately puts downward pressure on house prices.
For those of you interested on learning a bit more about this topic check out these two links to the Suburb Data podcast - EP 9 and EP 33 (sorry, the SquareSpace formatting wouldn’t let me paste them as embeded links like the other YouTube videos).
Current Macro Conditions (2026): Nothing much to talk about here from a macro perspective - there is probably more vacant / developable land in Australia than there is anywhere else in the world, so make sure you stay away from the greenfield estates and 'new suburbs' that will continue to pop up on the outskirts of regions / cities that are not land locked (e.g. Melbourne).
Selling activity:
Impact: This is a simple one but it is worth mentioning - when an influx of people in a suburb decide to list their home for sale it temporarily increases the amount of supply in the market at the time. This gives potential buyers more choice which therefore reduces competition and puts downward pressure on price growth.
There are many reasons why home owners in a particular suburb may disproportionately list their homes for sale at any given time - for example, it may be an investor dominated area and sentiment in the market may have reduced or it could be an area popular for holiday homes and increases in holding costs (whether that be through interest rate rises or government restrictions) have made the purchase no longer viable for the owners.
To minimise and track risks like this it is important to analyse certain data points such as the renter-to-owner ratio, stock on market percentages, inventory levels and many others which I will discuss in more detail later on.
Current Macro Conditions (2026): Based on SQM's data (a fantastic free website) you can see that total listings remains very low currently - especially when compared to the historic national averages, which indicates that generally selling activity is low which fits with the narrative we have discussed above that supply is very low in Australia (and will continue to be so). Here is the link to SQM in case this data is out of date as you are reading it.
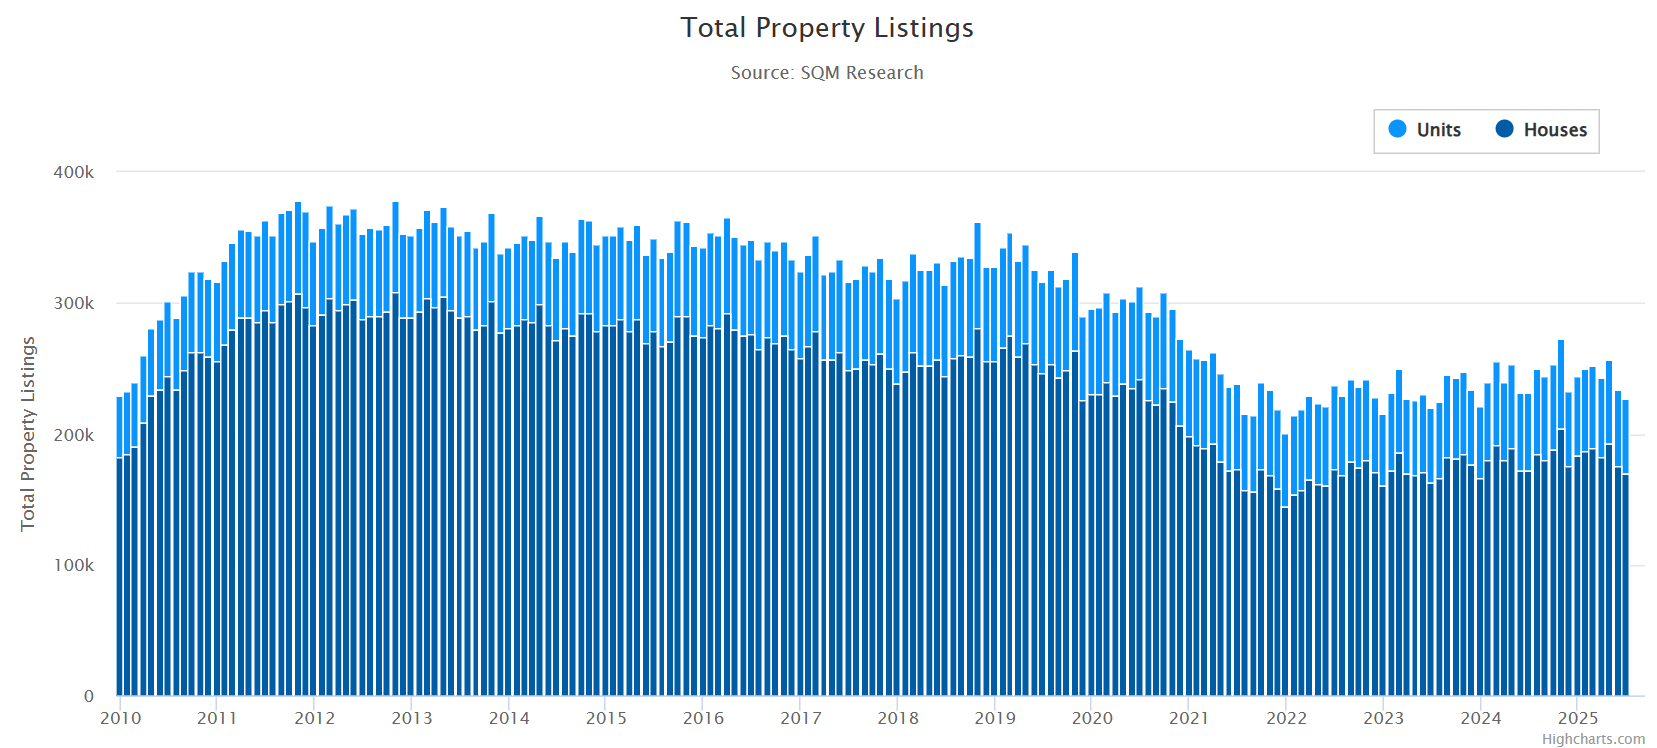
Now I have said 'generally' here for a reason - this is just a national level look at the current stock on market, it is imperative that you look at this data from a suburb level as there are plenty of suburbs with an abundance of selling activity which you will want to avoid - Step 4 on this website will show you how to measure this.
demand Factors
Population growth and immigration:
Impact: This one isn't too complicated. More people moving to Australia = more demand for housing.
However, it is important to ensure you contextualise where the population growth is occurring as it is not disbursed across Australia equally. Additionally, some areas experience the impact of population growth more severely than other areas due to land and zoning constraints, even if the total amount of population growth is lower (e.g. Sydney, which is land locked by the Blue Mountains). Check out '.id' for further information on population forecasts if you are interested.
Current Macro Conditions (2026): Australia currently has a very high immigration rate, and whilst this is projected to taper down over the next few years, Australia's population of 26 million is still projected to reach over 41 million by 2061 and the number of households is expected to grow from 9.2 million in 2016 to between 12.6 and 13.2 million by 2041. The below diagram from MacroBusiness shows this quite nicely.
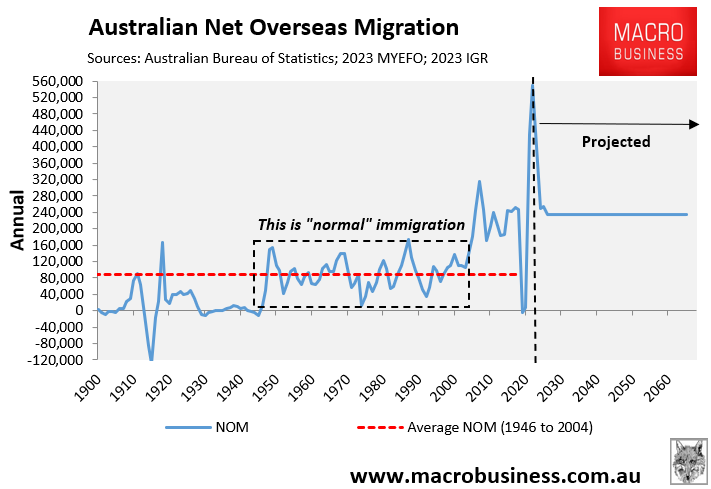
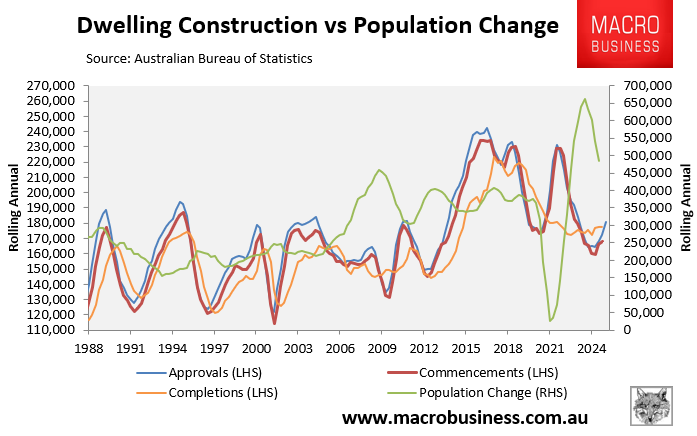
This means that in order for the housing market to stabilise, we will need to ensure our construction of houses keeps up with this projected population growth, otherwise house prices will continue to rise due to demand outweighing the supply. Spoiler alert: see below, it's not looking good.
Interest rates:
Impact: Lower interest rates reduce the cost of borrowing and increase a buyer's ability to service a larger loan - i.e. more people can borrow more money to spend on houses. However, this also means that as interest rates increase the demand to purchase property declines as people are able to borrow less money and consumer confidence (as discussed below) decreases.
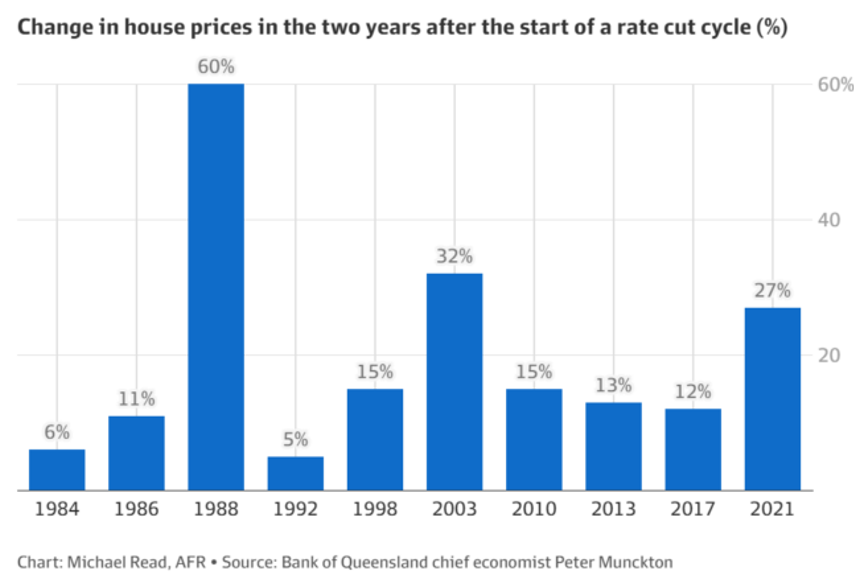
Current Macro Conditions (2026): After the very aggressive rates rises we saw from 2022 to 2023, the RBA started cutting rates in 2025. This was promising news for property investors as history and human behaviour (at least in Australia) tells us that when people are able to borrow more money to purchase a home, they often do it. The result being that house prices generally increase by an equivalent (or greater) amount. This is illustrated perfectly by the below chart from the AFR which shows that every time there has been an interest rate cutting cycle in Australia, house prices have increased.
However, unfortunately, at the time I am writing this the RBA has decided to increase interest rates at the start of 2026 and the RBA has never just increased rates once - it is always followed by at least another rate rise. With that being said, I am not an economist and I am going to make absolutely no predictions on where interests rates go from here.
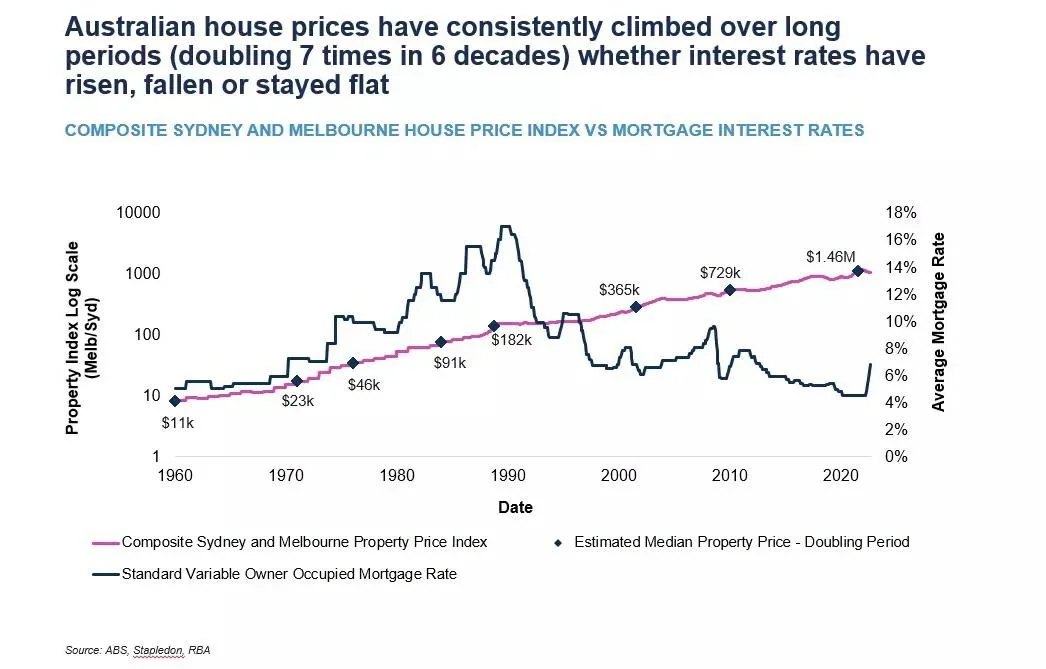
If you are a smart property investor, you shouldn't let interest rates dictate whether you invest in property or not - it is not as important as the media likes to tell you. Just because interest rates have risen or are rising this doesn't mean price growth doesn't occur.
For example, over the course of 2023 / 2024 we saw the highest interests we have seen in many years, yet national house price growth sat an impressive 8% (approx.) per annum these years with some cities like Perth, Adelaide and Brisbane experiencing around double-digit growth. This was due to a variety of reasons, but mainly due to the severe lack of housing supply and influx of immigration at the time - which shows you that not all these supply / demand factors are weighted equally but rather the market condition is a combination of them all, with some having more influence than others at certain times.
Here is a graph which shows how property prices have continued to rise during interest rate rising environments.
Income and affordability:
Impact: People can only purchase what they can afford, and if certain areas have become 'unaffordable' at their existing price point, meaning the local demographic cannot comfortably pay the mortgage repayments on properties in that area, then this limits the price growth that area will experience as buyers cannot afford to continually pay increased prices which will cause price stagnation or even decreases.
However, this also means as that affordability improves in an area - perhaps because interest rates have decreased or prices have stagnated across recent years whilst wages have increased, then this may fuel demand as the local demographic will be able to pay more than what properties are currently priced at in the area.
Current Macro Conditions (2026): You will have seen my breakdown of housing affordability in my Introduction on this website, but if you didn't, the below graph summarises it quite well - TLDR: housing is the most expensive it's ever been.
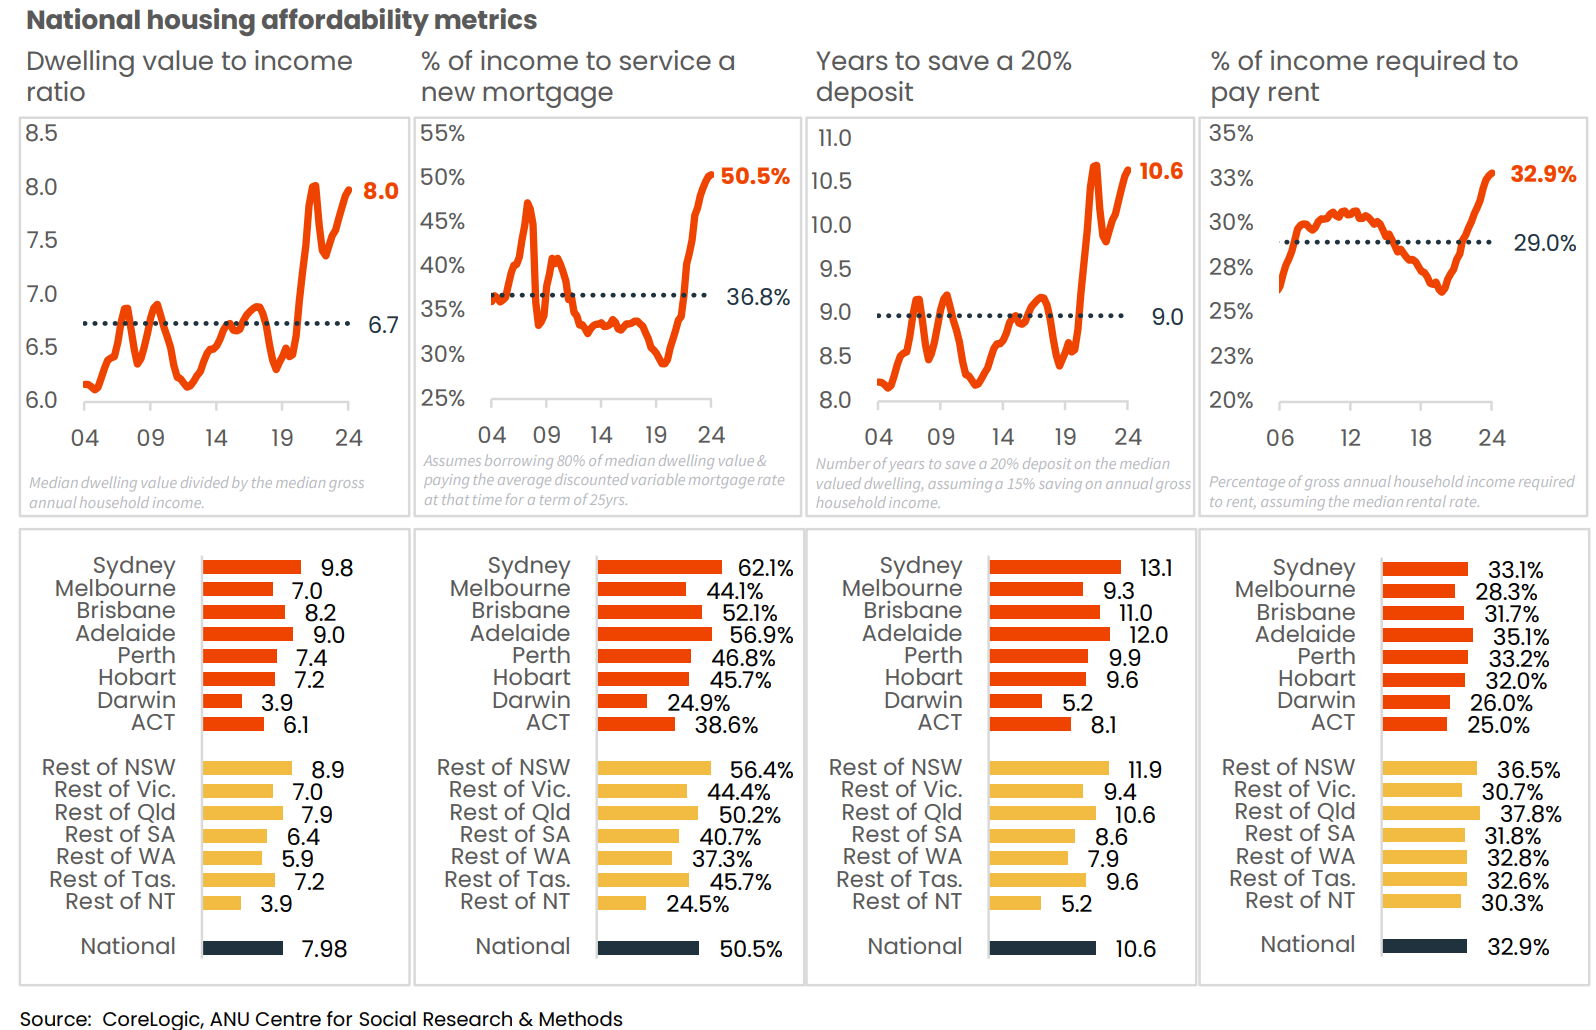
However, it is important to remember that affordability is relative and what is unaffordable to some is affordable to others - and there will always be certain pockets / suburbs that are considered 'affordable' to the local demographic. These are markets that we want to be targeting for our investment properties.
Government incentives:
Impact: Government incentives like First Home Buyer (FHB) grants, stamp duty concessions, and low-deposit loan schemes are designed to help people get into the property market, but they also tend to drive up demand — especially in the affordable end of the market.
When these incentives are introduced or increased (as they were at the back-end of 2025), many buyers who were previously priced out of certain price brackets can now afford to purchase. For example, a $10,000 grant or waived stamp duty might cover a deposit shortfall or help a buyer qualify for a larger loan. This suddenly increases the number of active buyers, all looking within similar price ranges, typically at the more affordable end of the market.
Because housing supply doesn’t adjust as quickly, this surge in buyer activity creates more competition for the same pool of properties. As a result, the Grattan Institute and the RBA have both found that the value of the incentive often gets “priced in,” causing prices to rise by an equivalent (or greater) amount to the incentive provided — especially in the more affordable markets.
Current Macro Conditions (2026): Here is a YouTube video from PK Gupta that summarises the housing policies that Labor and Liberal presented in the most recent Australian election and the impacts of each on house prices - now we know Labor won this election so the value in this video is more conceptual as opposed to influencing who you should vote for, this is an apolitical website!
Government restrictions:
Impact: Policies such as tighter lending standards, higher mortgage serviceability buffers, or changes to tax incentives like negative gearing and capital gains tax can directly reduce the number of buyers who qualify for finance or find property investment attractive. For example, when the banking regulator APRA imposed limits on investor lending and interest-only loans between 2014 and 2017, investor activity dropped sharply and price growth in cities like Sydney and Melbourne slowed.
On the other hand, easing these restrictions—such as reducing serviceability buffers, expanding first home buyer schemes (as we discussed above), or offering tax incentives (such as the CGT discount which I touch on below) can quickly stimulate demand by making it easier or more rewarding to purchase property. For instance, when APRA relaxed lending caps in 2019, and interest rates fell shortly after, investor demand returned and house prices increased.
Current Macro Conditions (2026): The current landscape for government intervention in the property market is relatively uncertain. They have recently banned foreign investors from purchasing established dwellings until early 2027 in a hope to curve some demand (which won't do too much given foreign investors only make up less than 1% of property transactions annually).
The more controversial potential changes revolve around the abolishment / amendment to negative gearing and the CGT discount. If I got a dollar for every time the media said that a political party was threatening to abolish one or both of these policies I had have enough money for a 20% deposit on a place in Point Piper. However, I would say the current threat on the operation of these policies is as real as it has ever been. Now I am not going to delve too much into the impacts on cutting these policies as ultimately I think we should (and people will) continue to invest in property regardless, but if you are interested here are some interesting videos from PK Gupta on each of these topics where he outlines the potential impact on the property market.
Consumer confidence and speculative demand:
Impact: For those of you who don't know, speculation in the property market refers to when people start buying property because they believe its value will go up (and they will make a profit as a result), as opposed to just because they need a roof over their head / want to live in that area.
Now whether or not you agree with real estate being a speculative asset class is irrelevant because the reality is that it is one (and you can thank John Howard's introduction of the Capital Gains Tax (CGT) Discount for that - this is a fact, not a political statement so don’t get triggered… this is an apolitical website).
Speculative demand is created as a result of all the things we mentioned above (i.e. decreasing interest rates, new government incentives, wage growth etc.) combined with influences such as positive media coverage on housing prices and more recently, other forms of media such as content produced by buyers agencies. This often results in a significant influx of investors entering certain markets and also creates a 'fear of missing out' (FOMO) amongst other potential buyers which causes rapid price appreciation, sometimes even beyond what the property is truly worth.
Current Macro Conditions (2026): Now I am not going to touch too much on the current consumer confidence levels in Australia as they change quite often and I ultimately think it's more important to track demand on a more micro-level, but if you are interested feel free to check out the ANZ-Roy Morgan Consumer Confidence measure which provides monthly updates on consumer confidence. Whilst there is debate about the causative impact of consumer confidence on house prices, history tells us that they do tend to follow each other - see below graph for reference.
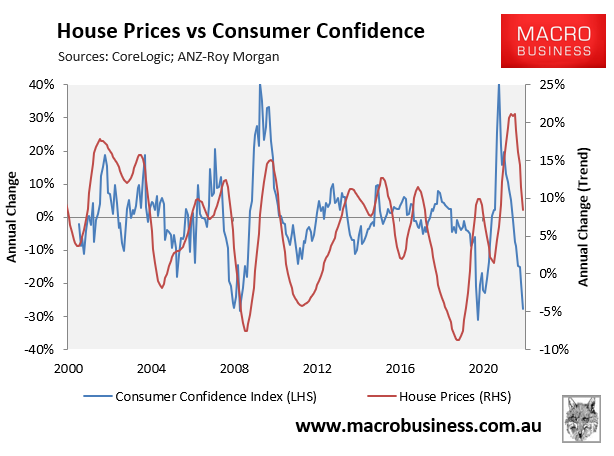
I would also look at the RBA Rate Tracker as consumer confidence in the property market seems to be influenced by the interest rate climate at the time.
If you read all of the above (impressive!), I hope that you have a deeper understanding of the relationship between demand and supply as well a snapshot of the current state of Australia's housing market - yes there is a housing crisis, but you now know why!
I am not sure how diligent I will be with updating the 'Current Macro Conditions' sections, so if you want to really stay on top of Australia's housing crisis I would suggest reading / listening to Leith van Onselen from macrobusiness.com.au (he also has a YouTube channel - https://www.youtube.com/@Leithvo) - he is a relatively no nonsense economist and as you can probably tell, I am a big fan of the data / charts he produces (for my sake, I hope he never reads this website as I am not sure how impressed he will be with me trying to use Labubus to explain supply vs demand). I have already mentioned many of his videos, but PK Gupta also provides some very good property related economic analysis (which may be a bit more digestible for a newbie than Leith's content).