Step 4 - Suburb Selection
Data Metric
Statistical Reliability / Data Confidence
Statistical reliability or data confidence (depending on what data platform you use) is a metric that indicates the accuracy of data.
It is calculated based on the average monthly sales per suburb.
DSR Score
DSR stands for Demand to Supply Ratio. The DSR is a score out of 100.
The higher the DSR, the more demand exceeds supply in the areas.
Gross Rental Yield
Gross Yield is how much income the property generates relative to its purchase price, usually expressed as a percentage and not including any expenses (that is the Net Yield).
Renter-to-Owner Ratio
Renter to Owner Ratio is the proportion of households which are renters compares to the owner occupier households (i.e. they have a mortgage on the property and live there too).
The higher the number, the more renters there are relative to owner occupiers.
IRSAD
IRSAD stands for Index of Relative Socio-economic Advantage and Disadvantage and is published by ABS.
The index defines people’s access to material and social resources, and their ability to participate in society.
For details see the SEIFA Technical Paper.
Affordability Index
Affordability is calculated in a few ways, with the most common either being:
(1) 'years to own' - i.e. how many years it would take the average person in the area to pay off their mortgage.
You can find this data on HtAG and Suburbs Finder (i.e. only paid sources). This is my preference as you can filter areas by this affordability index.
(2) 'households where mortgage repayments are less than 30% of household income'
You will need to get this data from the ABS Cenus (Quick Stats) - they have a section on this.
Check the trend analysis section, I have included some screenshots of what each method looks like.
Vacancy Rate
The vacancy rate is a measure of how many rental properties in a location are currently without a tenant.
Two figures are needed to determine a basic vacancy rate:
The number of rental properties
The number of these that are vacant
If there are 200 rental properties in a suburb and 4 of them are vacant, then the vacancy rate is 2% (200 ÷ 4 = 0.02 x 100 = 2%).
Source
Paid: all platforms I mentioned before
Free: HtAG (free version), SQM Research
Paid: all platforms I mentioned before
Free: Property.com.au
Paid: HtAG, Suburbs Finder
Free: ABS website
Paid: HtAG, Suburbs Finder
Free: ABS Census data
Paid: all platforms I mentioned before
Free: HtAG (free version), SQM Research, Onthehouse.com
Target Range
Insert your specific yield target based on your cashflow needs.
However, ideally the yield will be at least around 4%.
Anything under 35% of renters is ideal, generally the lower the better.
Over 45% is not favorable.
1 - 2 = Unfavorable
3 - 6 = Neutral
7 - 10 = Favorable
If the area you are looking at has a typical price of less than around $650,000 then an IRSAD less than 3 can be expected (and that is ok for this budget).
If the area you are looking at has a typical price of greater than around $650,000 - then you want an IRSAD of at least 3 but ideally higher.
For price ranges above $800,000 it is ideal to have 7 or above.
Lower than 2%
If you are using HtAG you may want to filter by less than 3 or 4%, then cross-check it with other sources to see if it is below the target range as based on my experience the HtAG vacancy seems a bit higher than other sources sometimes because I believe they use a slightly different methodology.
Trend Analysis and Guidance
No trend analysis needed here.
However, just for your knowledge, once an area starts to increase in price you often see yields decrease, as rents typically don't rise at the same rate as prices - this is known as yield compression.
You can also find properties with a higher yield than the suburb average, so don’t be too strict on the target range.
No trend analysis needed here.
However, I strongly recommend that once you have shortlisted a suburb for investment you should call the top three performing agents in the suburb and ask whether they are seeing mainly owner occupiers or investors buying in the area recently and over the past few years. You can use ratemyagent.com.au or realestate.com.au to find them.
If an area is seeing increasing demand from owner occupiers, especially first home buyers, that is a very positive sign.
No trend analysis needed here.
One thing to be cautious of is that if you are relying on the ABS Census Data option please note that this data is currently from 2021 and can therefore be outdated for some areas.
In particular, if an area has grown significantly between 2021 and the date you are researching then it may actually be no longer reliable.
The 'years to own' index from HtAG and Suburbs Finder is more up to date as it uses the current typical price of houses in the area.
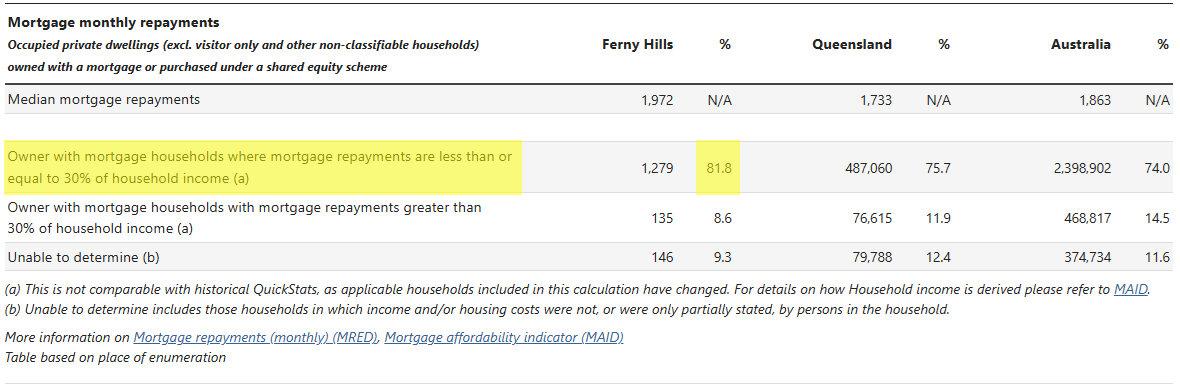
The below example of Ferny Hills show this perfectly, as you can see from the Census data it is well above our threshold of 75% at 81.8% (you may have to zoom in a bit to see this one).
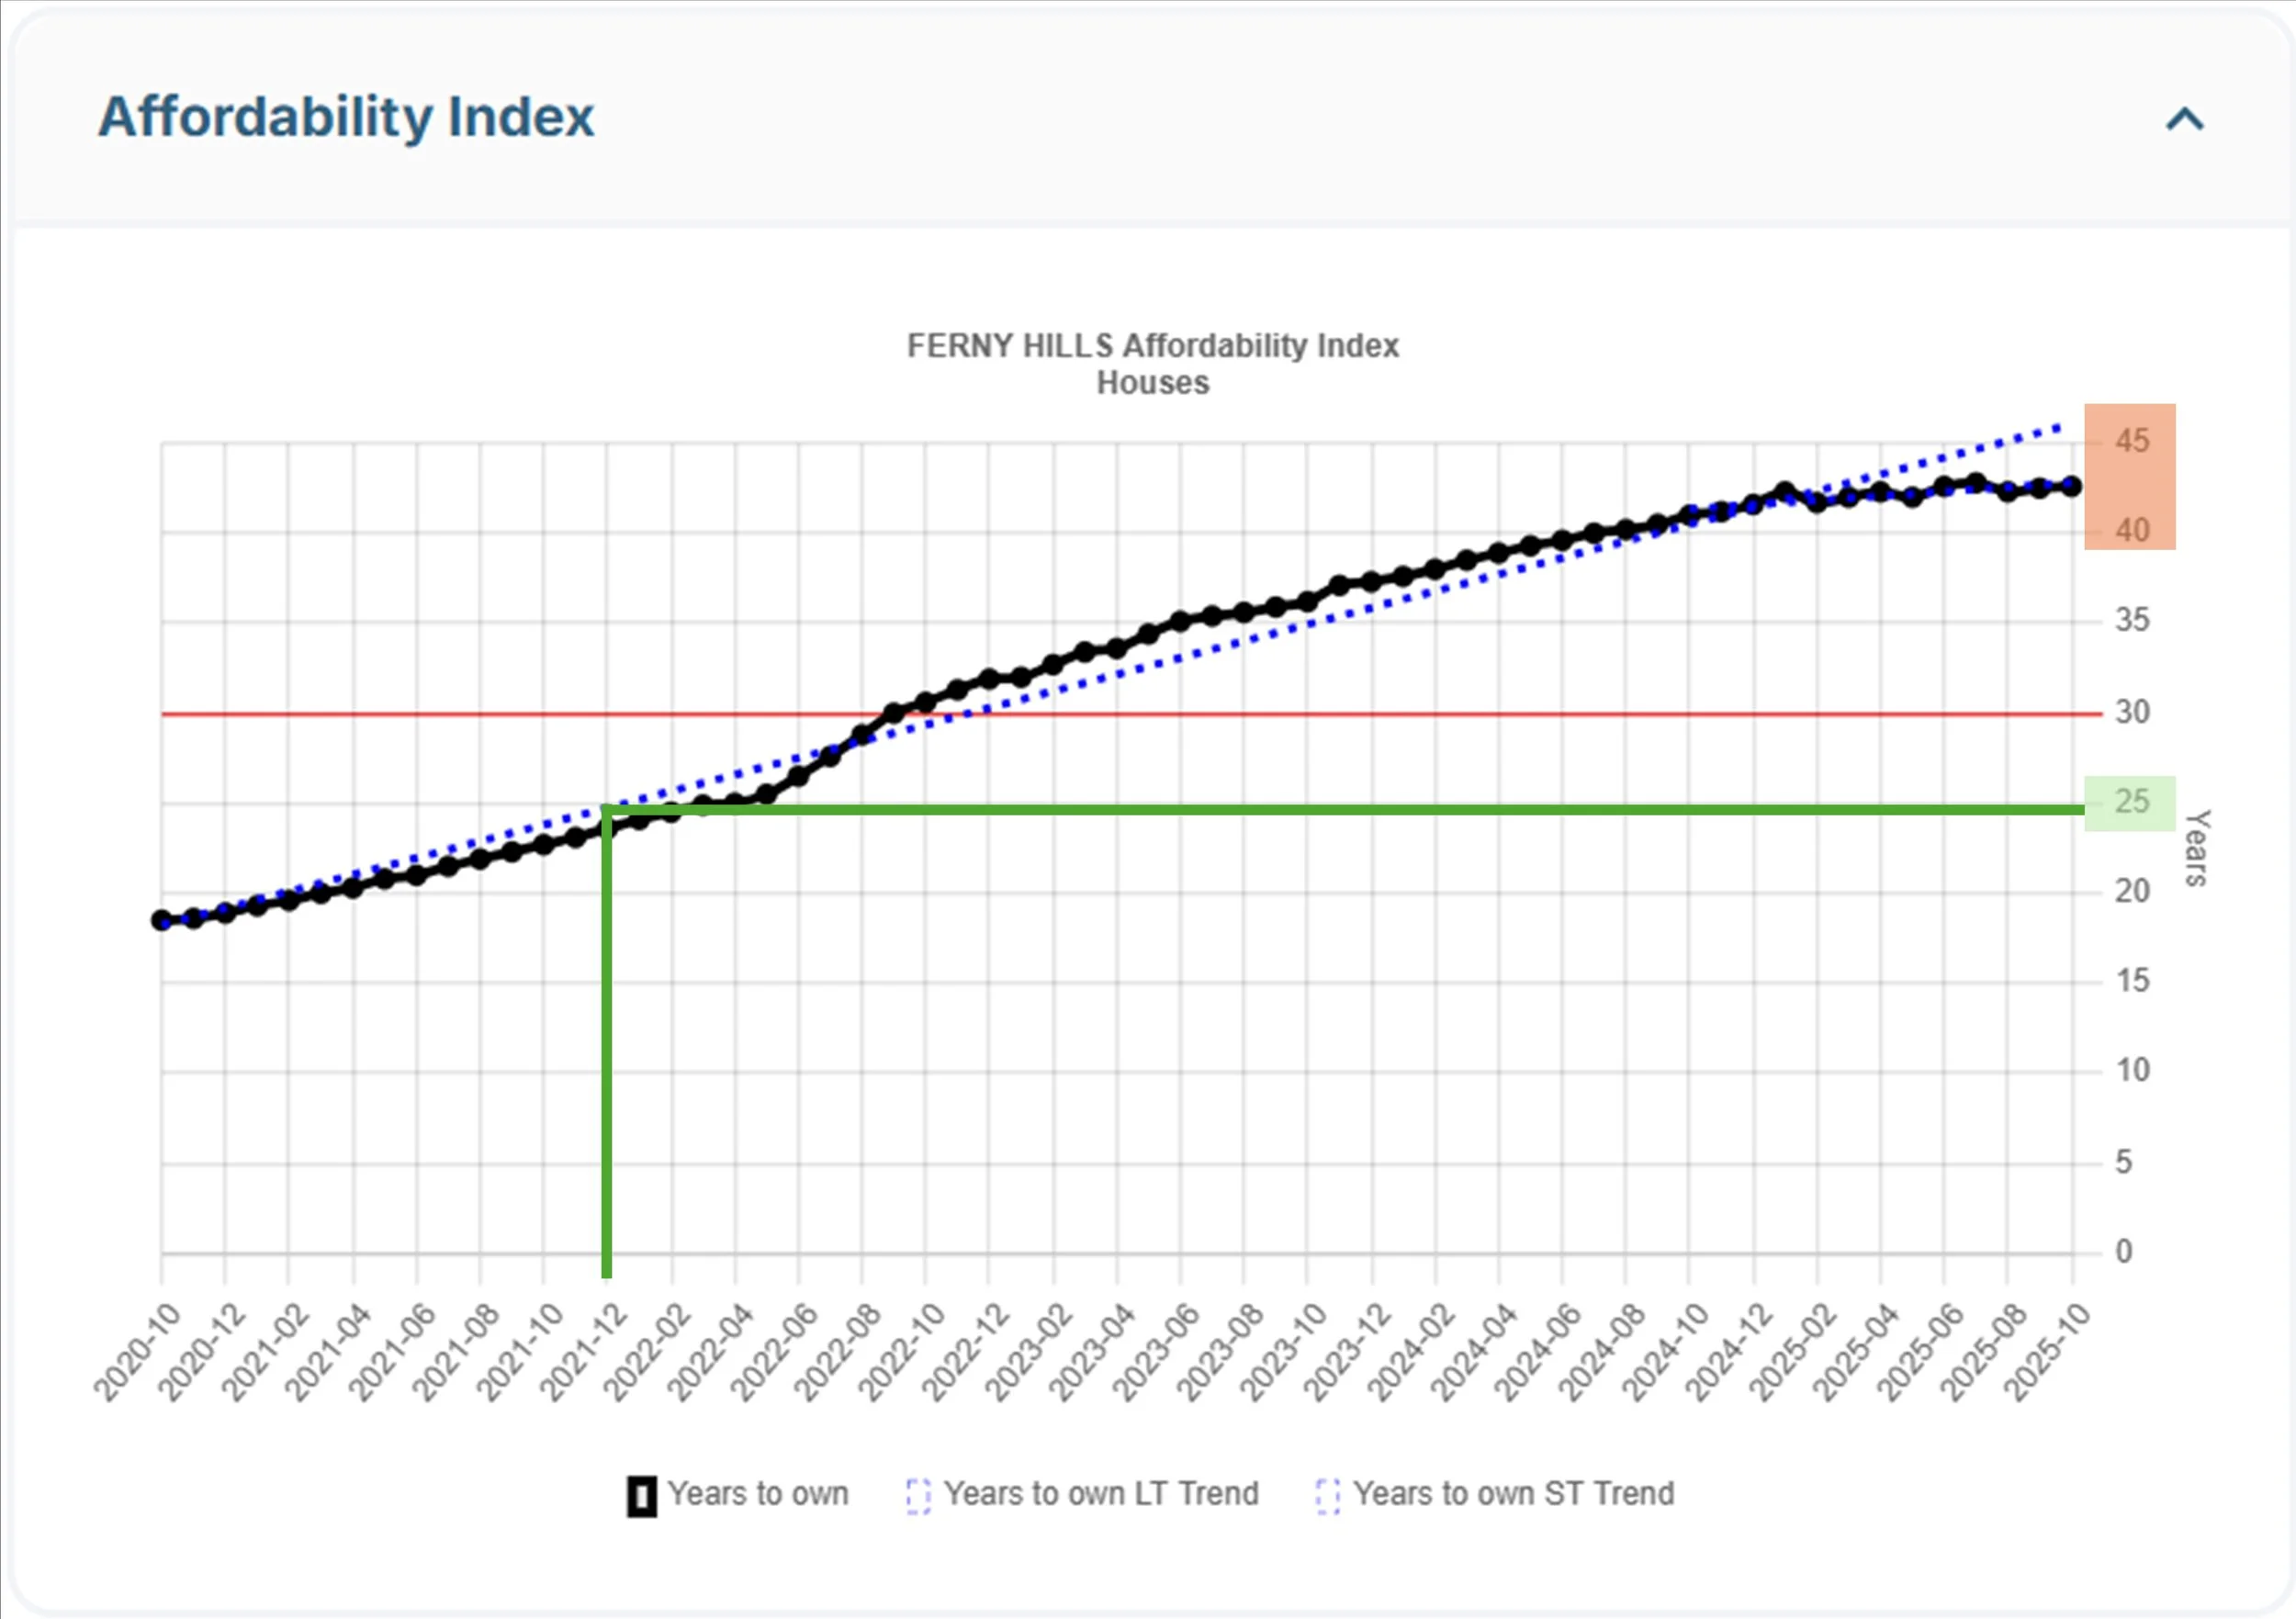
However, since 2021 Ferny Hills has experienced a significant amount of growth so that affordability data from ABS no longer tells us an accurate story and you can see this from the HtAG affordability index.
As you can see from the green line in 2021 it was only at 25 years to own which is within our thresholds (and is extremely affordable); however, the red box shows what it is at today's value which is approx. 43 years to own which is now above our threshold and therefore no longer considered affordable for the local demographic.
This doesn't mean you can't use the ABS Census data option, it just means that you should be conscious of the reliability of the data if an area has grown a lot (and if it has grown a lot there is a good chance that it won't meet the 'market cycle timing factors' we talk about later in this Step 4 - so don't stress, it should get filtered out at that stage if it is an issue).
The ABS Census data should also be updating very soon, but nonetheless, the same logic should still be applied for future data releases.
Ideally, we want a consistent downwards trend but the most important thing is that the vacancy rate isn't consistently above the threshold - please look at the long-term 12 months trend.
Sometimes with vacancy rates you can see big spikes followed by sharp declines - this can be for a few reasons but the mains are the following:
Seasonality - some suburbs will experience lots of vacancy at certain times of a year like Christmas. This should be clear in the long term data, but you can also check with property managers in the area to confirm.
Investor activity - when lots of investors flock into an area it can result in vacancy rates spiking due to an influx in rental listings. In these scenarios, it can be important to ensure there is a decline to indicate that the market is absorbing the stock and the vacancy rate won't continue to go higher.
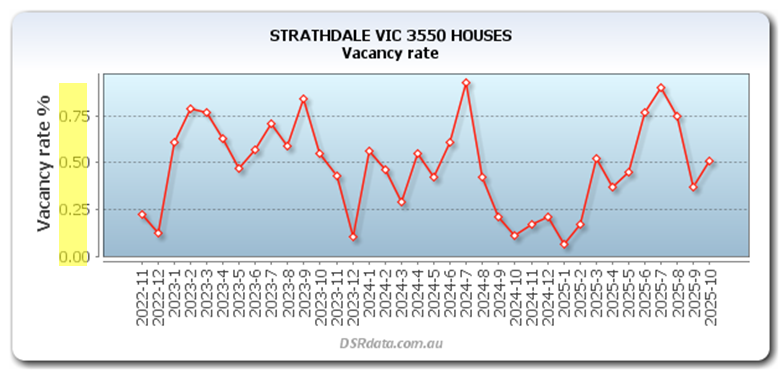
An example of these spikes is below - in my opinion this is fine and would not rule this suburb out because the vacancy rate is ultimately still very low.
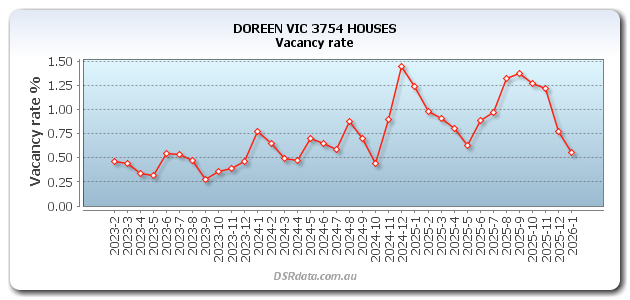
Please remember that sometimes a vacancy rate trend can look very sporadic but if this is because the Y-axis (in yellow) is made up of very small numbers that are underneath our threshold then that is actually a positive thing - see below for example where the vacancy rate has ranged from 0.00 to 1.00, well below our threshold, so the eratic up and down trend is not a major concern.
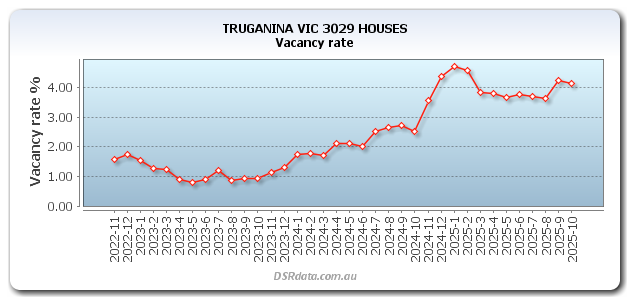
For reference, the below is an example of a very bad vacancy rate trend, where it is moving up and consistently sitting above a level far beyond our threshold.
No trend analysis needed here.
At or above the target range for at least the past 3 months, if it also has a general upwards trend then that is a positive sign.
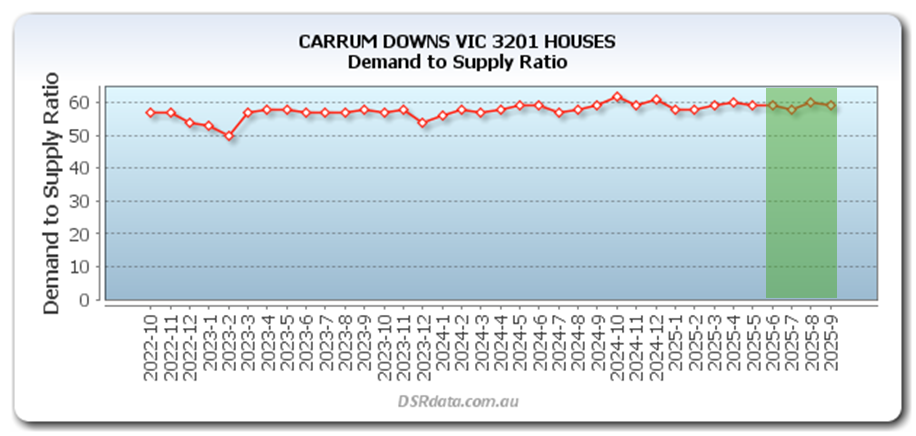
Example of a suburb consistently being within the target range (small fluctuations up and down are fine provided it is still within the target range):
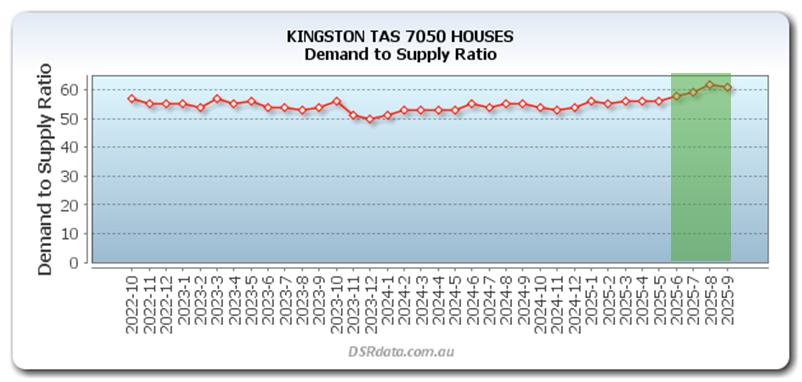
Example of the upwards trend above the target range which is promising:
Flexibility
Medium
The flexibility on this is based on your personal circumstances, if you earn a lot of money you can probably handle a yield as low as 3% and if you are on a low salary maybe you need to try get 5% (which is harder these days but it is still possible).
Rationale
See Step 1 where we discuss why we should be balancing yield and capital growth.
Years to own:
Price range of 650k and below = no more than 35 years
Price range of 650k - 800k = no more than 40 years.
Price range of 800k+ = no more than 45 years.
Mortgage repayments being less than 30% of household income:
Greater than 75%.
Low
You could flex this target range to around 40% if the rest of the data factors are very positive.
Medium
Areas will still grow if the demand and supply factors are favorable, so you can be slightly flexible on this factor, but I wouldn't be investing in many areas that are $650k+ but have a 1-2 IRSAD.
Low-Medium
Similar to IRSAD scores, if the demand and supply factors are favorable areas will still grow irrespective of whether they are affordable for the local demographic or not so there is some flexibility here, but I wouldn’t personally be investing in many areas that cheap (i.e. less than $650k) but are unaffordable for local residents (i.e. 40+ years to own).
Low-Medium
Vacancy rate is ultimately a cash-flow metric so if you have healthy buffers in place you can be more flexible if all other data factors match up, but for the average investor having a long vacancy periods between tenants will put a big financial stress on your life.
Low
However, if the suburb is close to the target range (i.e. Medium confidence on HtAG) and if there are suburbs nearby which meet the target range you can also check with sales agents and property managers to verify the accuracy of the data you are seeing on the relevant platform.
Medium
The DSR score can help as an initial filter to narrow down the results, but it shouldn't be followed blindly.
However, I wouldn't be investing in suburbs below the target range unless the trend was very positively moving towards the target range and all other data points looked strong.
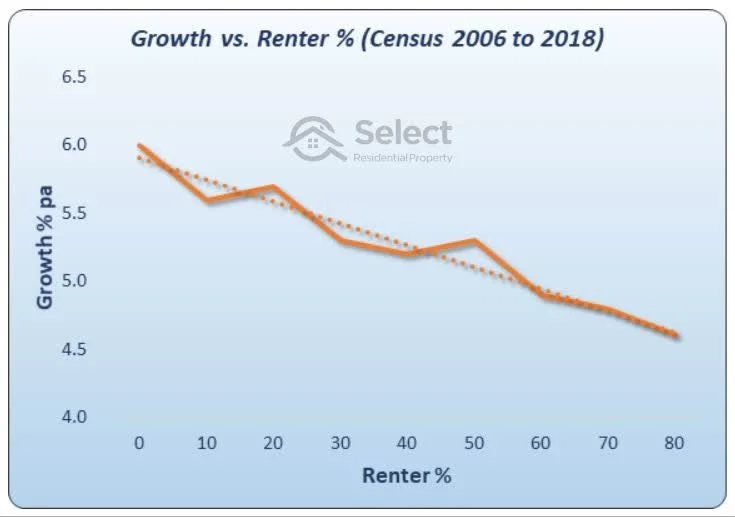
Owner occupiers make up over 70% of the real estate market, they are emotional and they are the buyers who drive prices up in an area - especially over the long term. Not investors…
For this reason, the data shows that that the lower the amount of renters in area the higher the capital growth is. See the graph below:
Areas with lower renter-to-owner ratios are also generally safer investments because:
During periods of negative sentiments or financial difficulties owner-occupiers are much more likely to try hold on to their property at any cost which keeps supply lower; whereas investors are more inclined to sell which can result in an oversupply of houses in those areas; and
The more investors in an area the more rental stock which is available and that can also decrease the amount of rental growth an area will experience and can also increase the risk of longer vacancy periods as tenants have more options to choose from.
Having an area with strong socio economic factors is a good indicator of an area having the propensity to experience long-term sustained capital growth.
If an area is unaffordable for the local demographic it is less likely that houses prices in an area will be able to grow long-term at a sustainable rate as people will not be able to afford to pay higher prices.
Higher vacancy rate will mean longer vacancy period between tenants which can have a big impact on your cash flow.
Lower vacancy rates also means there is a bigger pressure on rental prices which often results in rents increasing in the area and growing rents in an area is often followed by growing house prices so it can be a good indicator on sustainable demand.
There is an abundance of free data online, but it is very difficult to ascertain how reliable it is - for some small areas or tightly held pockets it can take just one sale to make the data unreliable.
This is why investing in paid sources of data at this stage is very important to ensure you are analyzing reliable data.
You don't need to use this source on your property investing journey, HtAG or Suburbs Finder on its own is perfectly fine.
However, the DSR score takes into consideration a range of factors we discussed below like:
Auction clearance rates
Days on market
Stock on market
Vacancy rates
So it can be a useful way of double checking your analysis is taking you down the right path.
I believe it's possible to check the DSR score on DSR Data for free, but you can't see the trends or statistical reliability so I don't recommend it. However, with the Suburb Data (DSR3) pay-as-you-go method you can order the DS3R score for like less than $1 so you could even do this to sense-check your shortlisted suburbs to make sure you are on the right track if you wanted to.
Paid: all platforms I mentioned before
Paid:DSR Data or Suburb Data (DSR3)
Free: DSR Data*
*You will need to create an account still, and won’t get access to the trend data unless you get the paid version
DSR Data: anything over 51
HtAG: High confidence only
The other platforms will have a similar metric and the target will be similar - check the platform's guidance.
DSR Data: anything over 53 - the higher the better.
DSR3: anything over 60 - the higher the better.*
*Noting I haven't used the DSR3 platform extensively just yet but this is based off guidance provided by Suburb Data