Step 6 - Valuing and Inspecting Properties
If you have ever wondered why you keep getting outbid when trying to buy a property it is most likely because you undervalued the property you are looking to buy.
"But my offers are always within the range that the agent quoted?"
Sorry to break it to you, but 90% of the times the ranges quoted by agents are bullsh*t. They are often intentionally low in order strum up more buyer interest, or in other words, they are "underquoted". Now some states are trying their best to crack down on underquoting; however, I wouldn't be waiting on the government to solve this issue before you go out and buy a property because my bet is that the average price for an asbestos shack in Mount Druitt may be $4 million before that ever happens.
Instead, what you need to do is spend time and learn how to assess the "current market value" of a property so you are confident on how much you are willing to offer and when to pull out before you overpay.
So how do you do this? Well I will tell you what you don't do first, and that is rely on the various online valuation tools because they are almost always wrong and/or outdated.
Instead, what you want to do is perform a "Comparative Market Analysis", which involves downloading the spreadsheet I have linked below (again, am I generous or what?) and follow the steps outlined below.
Step 1: Using Domain or realestate.com.au, go to the 'Sold' section in the relevant suburb then sort by ‘most recent’ and find at least 5 comparable properties as close to your relevant property as possible.
Ideally we want to be picking properties that have sold in the last 1 - 6 months, but this may not always be possible. However, you shouldn’t be comparing properties that sold more than 12 months ago.
Step 2: You want to compare properties which are as fundamentally similar to your relevant property as possible, they can be inferior or superior in certain ways but generally speaking you want them to be:
in the same pocket of a suburb (may not always be possible, so as close as possible is fine)
not on a main road or beachfront (unless the property you are looking at is also), as this will skew the price quite significantly
the same amount of bedrooms
similar land sizes
Step 3: After you have your list of properties, you want to compare them on the following factors and determine whether the comparable property is "Inferior", "Similar" or "Superior":
number of bedrooms
number of bathrooms
garage / carport space
land size
year built (you can find this information on propertyvalue.com.au or the even the sales history on Domain or Realestate.com.au)
general condition
any special features (i.e. renovations, extra living rooms, sheds, closer to a beach etc.)
This isn't a perfect science, so you will need to make a call based on your own judgement using the above factors.
Step 4: You want to look at the sold prices for each of the comparable properties then "index" them for the growth in the suburb since the date that they sold - this will make sure that you are comparing properties at the price they would sell for today.
This is especially important in warm / hot markets where prices are moving quickly every week / month. If you don’t do this you will be valuing the relevant property today using yesterday's prices, which may result in you continuing to miss out on properties as you are not offering market value. I touch on how to undertake this “indexing” below.
For reference, in the excel spreadsheet I linked at the start of this page I have included a worked example on what this entire Comparative Market Analysis process should look like.
How to index for past growth
Feel free to do this anyway which makes sense to you, even try ChatGPT as it may do this very quickly, but for now I am going to show you the ol' fashioned way - which involves going to 'onthehouse.com.au' and go to the 'Suburb Research' section and type in the relevant suburb.
I am using 'Frankston VIC 3199' for the below example and let's assume I am doing this CMA in December 2025.
Step 1: We need to get the current median value for the suburb, because onthehouse.com.au is always 1-month behind.
We want to use the below graph to get current median value available from onthehouse.com.au (which will be November as there is a 1-month lag), then get the median value from the second-latest month (i.e. October).
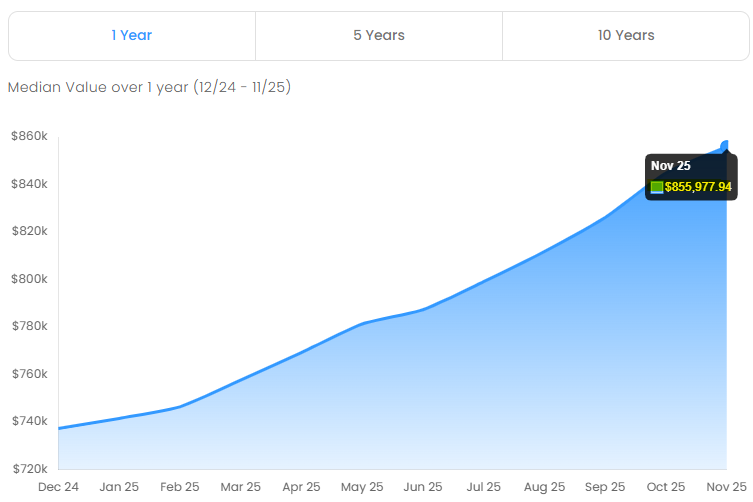
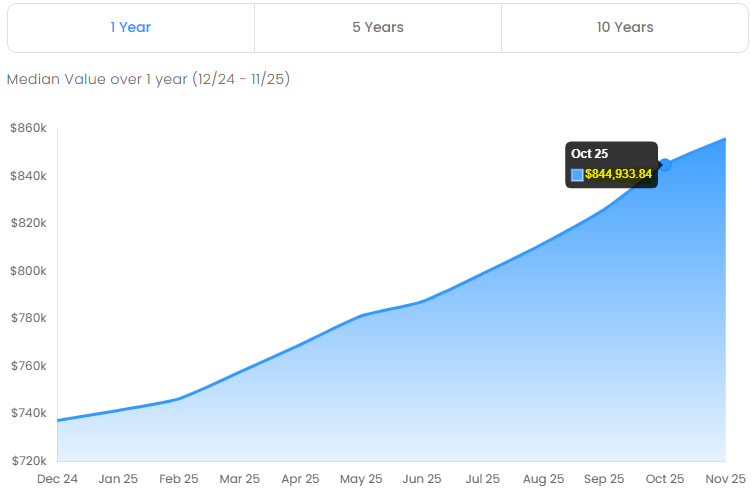
Then we divide the latest median value by second latest median value (i.e. we divide November by October) then multiply it by 100 to get a percentage - which will be 101.3%
Just use ChatGPT guys, see the relevant calculation below…
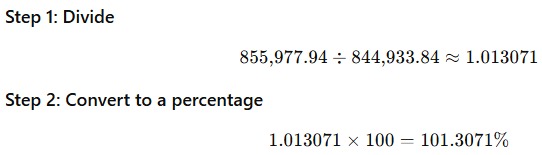
After this we want to use that percentage and multiply it by the latest available median value (i.e. November) - this will give us the approximate current median value (i.e. December) - which will be $867,166.43

Step 2: We use the current median value for the suburb to get the indexed value of the comparable sales we are looking at
To demonstrate this, let's say we have a comparable sale from September 2025 for $830,000 and we want to determine what it's indexed value is.
We go back to onthehouse.com.au and get the September 2025 median value ($826,202.86) then we divide the current median value we calculated above ($867,166.43) by this number and multiply it by 100 to get a percentage.
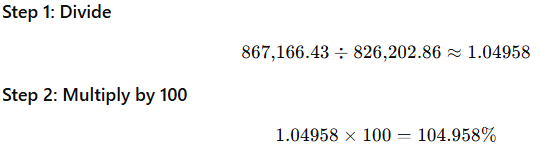
Then we use this percentage and multiply it by the price of the comparable sale (i.e. $830,000) - this will give us the indexed value of the comparable sale (i.e. what it would be worth if it sold today) which we can then use to accurately assess the value of the property we are valuing for purchase - which will be $871,151.40.

As you can see, prices in Frankston rose extremely quickly in 2025, as a property worth $830,000 in September would be worth approx. $871,151 in December - which as someone who owns a property in Frankston I can attest this was very much the truth.
This shows you the value in doing this analysis because if you were just looking at September values and put in an offer in December for around $830,000 on a very similar property you would likely miss out on the property because its true value is approx. $40,000 more than what you offered.
Step 3: We rinse and repeat this for each of the comparable sales based on the month they sold
Once you have done this, you will have an 'indexed' sale price column which you can use to accurately assess the current market value of the property you are looking to purchase.
You want to look at all the properties based on how you have categorised them (i.e. "Inferior", "Superior" etc.) then look at the 'indexed' value and come up with a range for the market value of the property you are trying to purchase.
This is not an exact science. You will need to apply some common sense and independent thought.
For example, if a superior property sold for $870,000 (indexed) and an inferior property sold for $850,000 (indexed) then you could assume your property is worth in the middle around $860,000. That's all there is to it.
The spreadsheet I circulated at the start contains an example for those people who are confused - use it as a guide. This may be tedious the first time you do it, but once you do it once for a property in a suburb the future times you do it for a property will be much quicker I promise. I have actually inserted some formulas into the spreadsheet in the cells relevant to the indexing process in order to make it as easy as possible for you.
Feel free to also cross-check your CMA against the valuation that your mortgage broker has to do for lending purposes. Also feel free to check out the below videos for more information. I quite like the video from 'Pitch Property' as he adds some additional specificity regarding '$ per square metre' which I think can be quite useful (but not strictly necessary) for those astute students in the class.