Step 4 - Suburb Selection
As I flagged in the “Suburb Selection Methodology” page, using paid platforms like HtAG and DSR you will be able to insert some / most of the suburb factors which I have outlined in this Step 4 and filter down the 15,000+ potential suburbs in Australia to a list of 20 - 100 suburbs.
I appreciate it would be useful to get some further guidance on this, so I have included some potential filtration searches which you can use to narrow down your list of suburbs. Noting this is just for HtAG and DSR, but you can adapt these to other paid platforms as they all have a similiar way of filtering suburbs. Noting that for each of these platforms it is also possible to filter for houses or units (which includes townhouses).
HtAG filtering
If you are using the HtAG platform, in the ‘Suburb Shortlisting’ section you will see that there are actually some pre-populated filtering ‘strategies’ you can use depending on your budget and goals. You can then amend the pre-populated filters to include more (or less) data factors - which is similiar to ‘Example 1’ below. Alternatively, you can ignore the pre-populated filters and create your own based off the data factors we have discussed previously - which is similiar to ‘Example 2’ below. Another option is just using the pre-populated filters from HtAG as is…
Example 1

Example 1
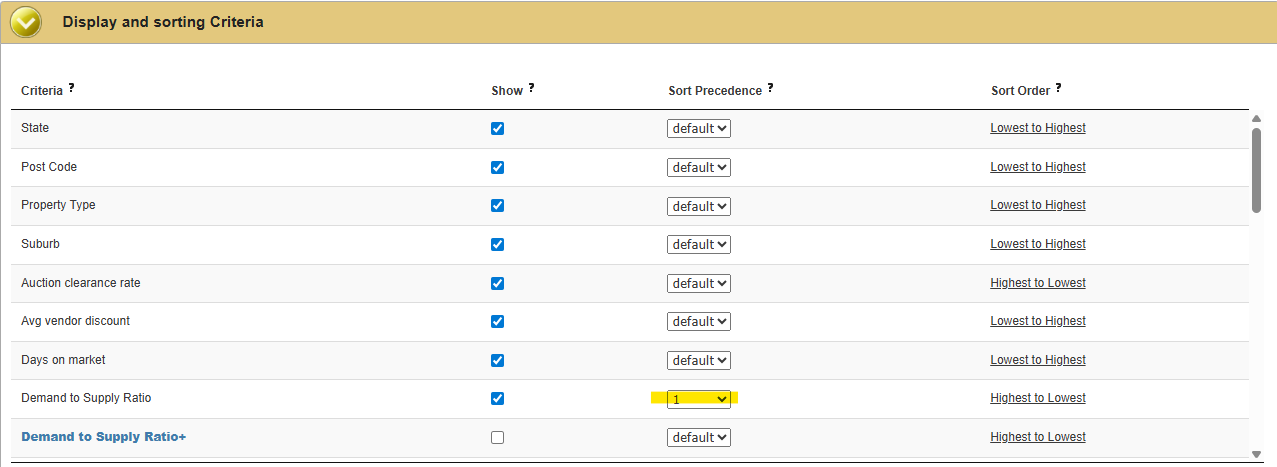
If you are going to use DSR it is also important that you “sort” the results of the filtering process so that those suburbs are listed from highest DSR score to lowest - an example on how to do this is below in yellow.
Step 1:Use the ‘Dex’ system to compare all suburbs in the shortlist.
I have included a link to HtAG’s description of the Dex system - I also highly recommend doing the Mastermind session / free tutorial on how to use this comparison tool as they will explain it better than me.
However, in summary, the Dex system allows you to compare the entire list of shortlisted suburbs by assigning a weight to a variety of metrics and the algorithm will then give each suburb a score based on those metrics which you have deemed more important. This is extremely useful because, as we have discussed, not all metrics are equally as important.
There is a ‘Dex Lite’ and ‘Dex Pro’ - but the HtAG team has been generous enough to pre-populate the metrics for you based on which ‘strategy’ you choose (you can find these next to the ‘Compare’ button and there is an explanation of each on the HtAG website). This means that you could literally go and click the ‘Compare’ button and ‘Generate Dex Scores’.
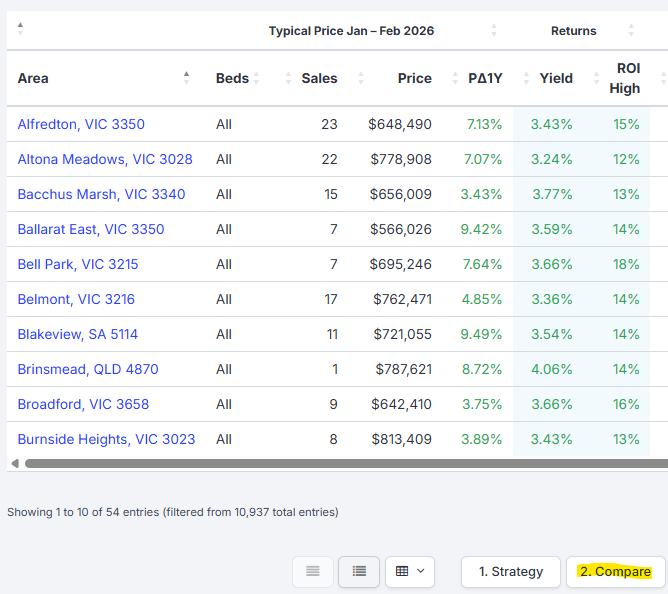
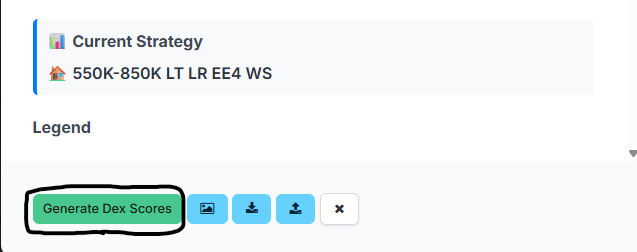
Once you have done this, your shortlist will automatically sort from highest to lowest in terms of Dex Scores.
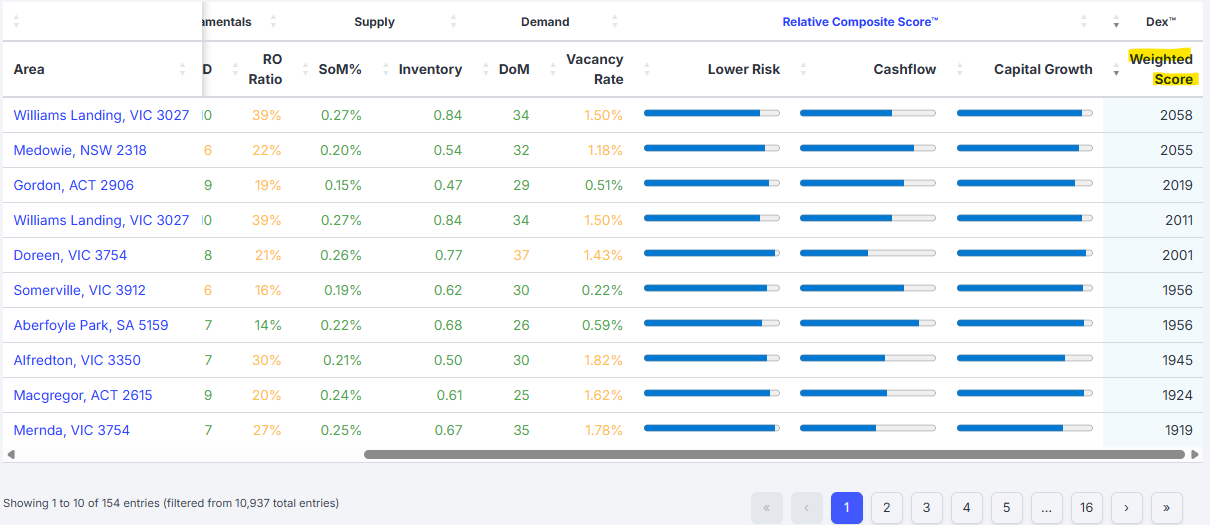
I just want to reiterate that you should invest time in understanding how to use the Dex system as these pre-populated weightings may not align with your personal strategy - they are standardised, so you need to learn how to personalise them (however, they are a good base).
Step 2:Review the top 10 based on the Dex Scores and disregard those which are not in diversified economies or are clearly in greenfield estates / surronded by developable vacant land.
Depending on the filters you have applied, it is likely that no suburbs will need to be disregarded; however, just in case you should do this anyway and this will just involve you clicking the ‘name’ of the suburb which will automatically take you to its suburb page which has a Google Maps extract - from there it may be immediately obvious that it is a tiny rural town or is surronded by vacant developable land etc.
Alternatively, you may need to briefly apply the ‘City / Region Factors’ we discussed to see if it is actually a diversified major regional town that may be worth considering. For reference, HtAG has an ‘EDI’ / ‘Economic Diversity Index’ and ‘Lower Risk RCS’ score which should guide you as to how risky a location is, but I still like to double check using the methodology I showed earlier just to be sure.
Noting you may need to quickly checking the zoning with respect to developable land - if you applied the right filters all the areas will have low building approvals anyway but it is worth checking the future supply risk in any event.
Step 3:For the remaining suburbs, identify and disregard all areas that have already grown too much over the past 5 or 7 years.
If you applied the filters correctly you will not need to worry about the 3 year growth, and you may not even need to worry about this step at all. However, sometimes suburbs which have grown over 70 - 100% in the last 5 - 7 year period can creep in, so it is best to just to double check then disregard as necessary.
Example 2

For reference, the metrics which contain “LS” means “Long Slope” which is another word for long-term trend, they also have metrics such as “SS” which means “Short Slope” which is another word for short-term trend.
When you make these “LS” and “SS” metrics equal “Less Than 0” this means the slope is trending downwards - this is very useful as it means we can filter out suburbs which have bad trends for key supply metrics like stock on market and inventory. This is one of the many reasons I prefer to use HtAG as not many other platforms offer metrics like this.
Another great feature of HtAG is that you can filter based on the data for a specific amount of bedrooms - this great because sometimes the average typical price for a suburb may be out of your budget, but this may be because the 4 bedroom houses are expensive and it is bringing the average up and you could actually afford to purchase a 3 bedroom house in that suburb. Additionally, sometimes the data for a 3 bedroom house in a suburb may actually be better than a 4 bedroom at certain times - i.e. perhaps because it is more affordable.
I should also note that the above is actually a lot of filters, and some people may prefer to cast a wider net and remove some filters so they can consider more suburbs - this is especially powerful if you invest some time in getting used to the ‘Dex’ comparison tool I will discuss later.
DSR filtering
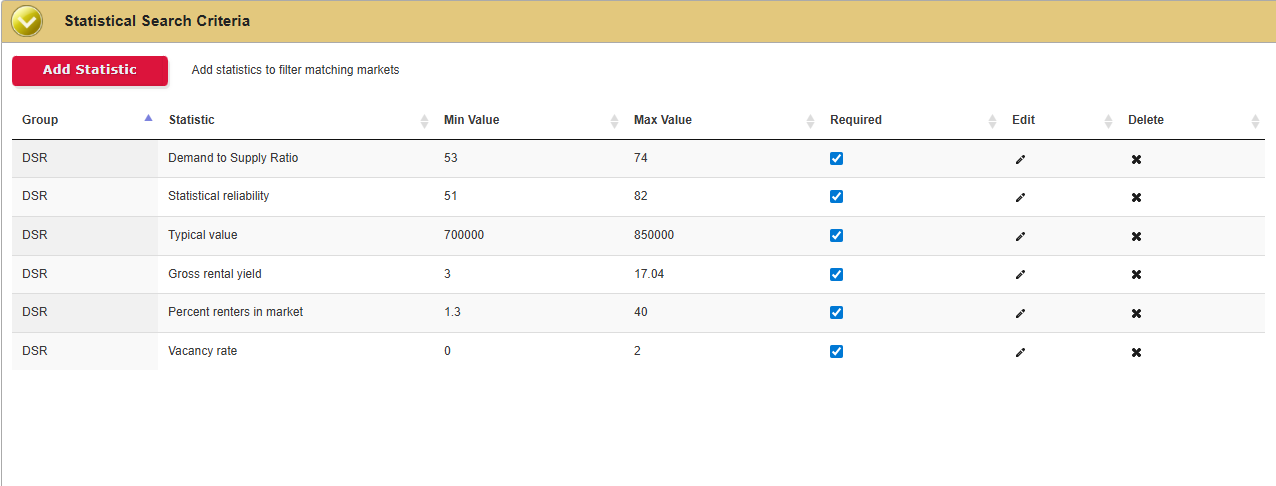
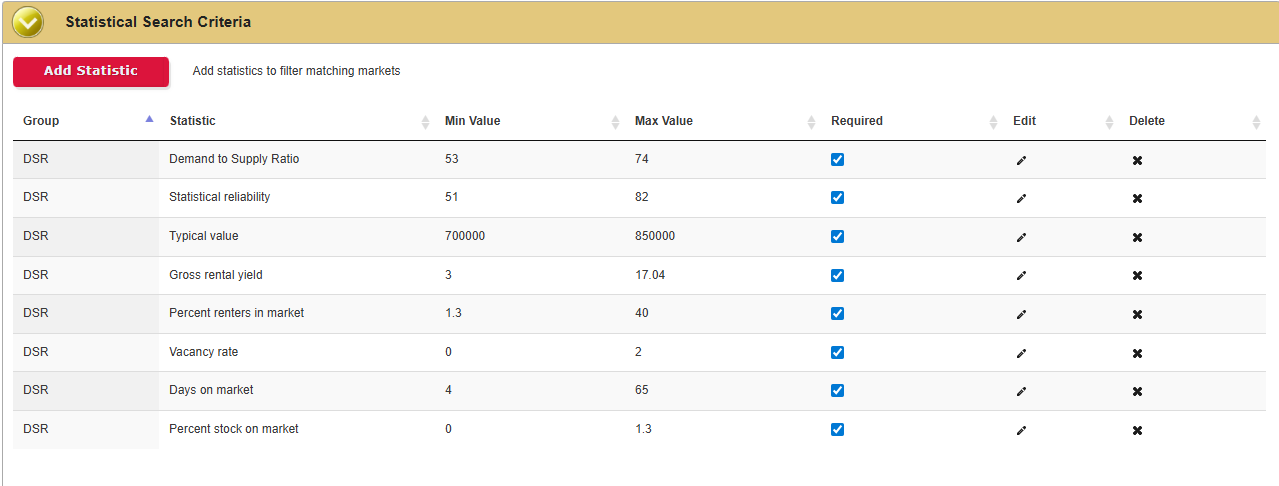
The DSR filtering system (known as ‘Market Matcher’) is much more simple than HtAG and doesn’t allow for as many metrics (unless you get the DSR+ subscription or use the DSR-3 platform) as their is more significance / weight applied to the ‘DSR Score’.
Most investors either use DSR in a way which just filters using certain fundamental / strategy related filters as the DSR Score will capture and measure all the supply / demand metrics anyway - which is similair to ‘Example 1’; however, other investors may add a few additional filters relating to supply and demand in order to create a more refined list of suburbs - which is similiar to ‘Example 2’.
Example 2
DSR Users
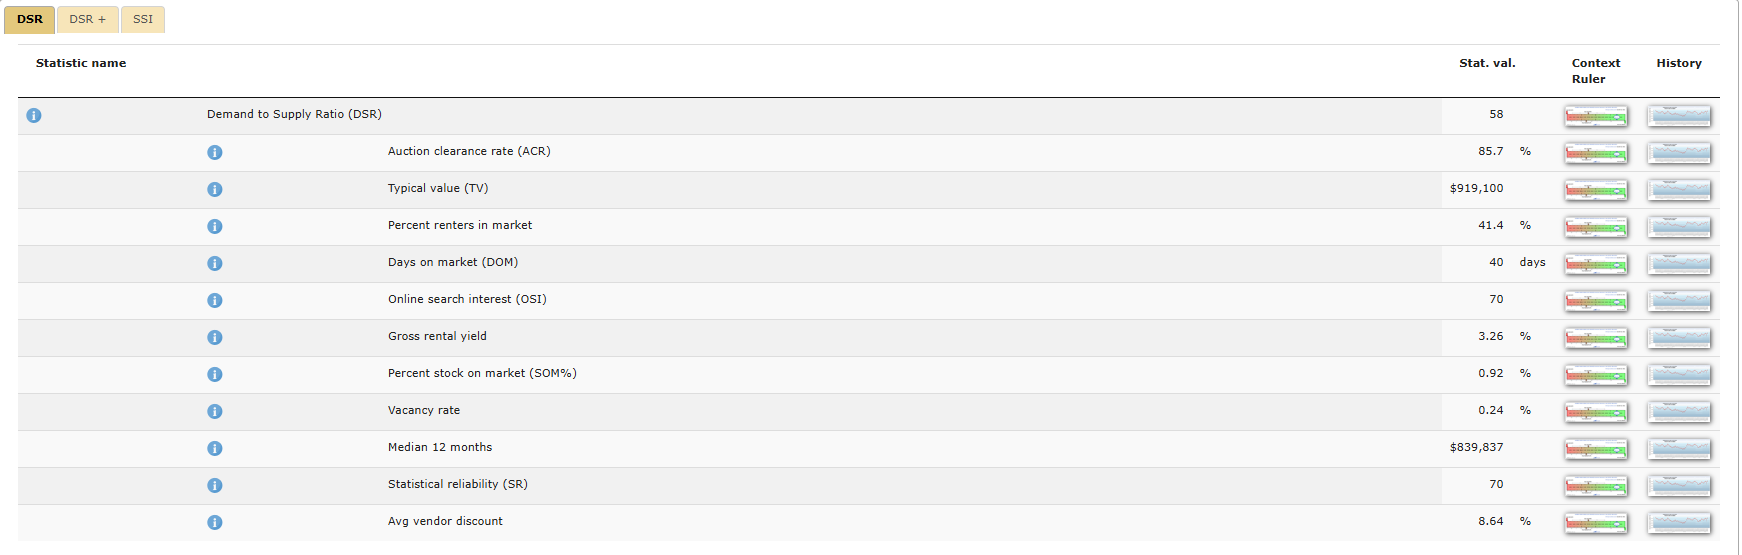
Noting that if you want to see the specifics of each suburb, including the data trends, you will need to open the “Suburb Analyser” section in a seperate tab and search the relevant suburb - it should look something like the below.
Now there is a few things to note here, during this filtering process you will see HtAG provides you a much more refined list - this is because it has much more filters than DSR (such as affordability, building approvals, price change etc.).
It is also easier to measure the 'Market Cycle Timing Factors’ in HtAG and filter out those suburbs which don’t meet the relevant metrics - for DSR you will need to either do this manually or purchase a DSR+ subscription or use the DSR-3 platform to do this. This doesn't mean HtAG is better than DSR, but just something I wanted to flag in case you are wondering why the number of results are different for each platform.
Comparative analysis
Once you get a list of suburbs from one of these platforms the analysis isn't complete - you don't just try find a property in any of the shortlisted suburbs or the one with the best DSR score (if using that platform), because as you will notice the search criteria used above doesn't capture all the data factors we mentioned in this Step 4 (e.g. the macro-economic factors) and the data platforms automatically weigh all data factors the same, which you now know is not the case as some are more important than others.
This means the next step is then: to create a shortlist of 3 - 5 suburbs and compare them in order to choose a suburb to invest in.
There is no perfect way of doing this and it will vary depending on what data plaform you end up using; however, I have outlined a general approach for users of HtAG and DSR which can then be adapted accordingly depending on what platform you are using.
HtAG Users
Step 4:For the remaining suburbs, consider whether there are any other suburbs with high Dex Scores or good supply / demand metrics which are in close proximity.
In this step we want to see if there is a “cluster of strength” in a specific area, we do this by checking if there are suburbs with high Dex Scores or strong supply / demand data which are surronding any of those remaining suburbs on your shortlist - i.e. maybe they are next to each other or a few suburbs a part.
This is important as it provides us with more confidence that this area has a strong imbalance of supply and demand - rather than being a one off / outlier suburb.
On HtAG there a few ways you can do this, and you may chose to do a combination or just one of these:
Use the GeoDex function, which is essentially a type of ‘Heat Map’ showing areas of strength based on various metrics weighted by importance - I won’t go into too much detail on this, check it out on HtAG if you are curious.
Use the ‘Suburb Shortlisting’ function to limit the search to the GCC / SA4 area near your shortlisted suburbs and assess the Dex Scores / supply and demand metrics.
Use Google Maps and check if the suburbs nearby are also in the filtered list, there should be a “Search” bar which lets you search your filtered list specifically - however, it is probably better to search them up individually then asses their supply / demand dynamics manually as they may not show up in your list due to reasons like price etc.
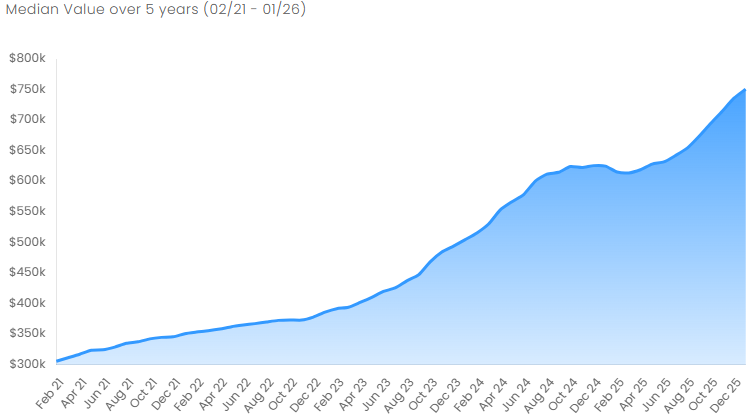
See the South Morang, VIC example used in step 3 of the DSR users on the right hand side of this page - this example of a cluster applies equally to HtAG analysis. The same applies for the macro-cluster points I mentioned too - i.e. if a certain State / City is showing a lot in your filtered list then that is also promising. For example, if you scroll back up to that shortlist created by the Dex comparison in step 1 you will see a lot of VIC suburbs, specifically in Melbourne - which gives me confidence about investing in that area.
Step 1:Review the top 10 - 20 suburbs based on the DSR Score and disregard those which are not in diversified economies or are clearly in greenfield estates / surronded by developable vacant land.
This will just involve you clicking the ‘name’ of the suburb which will automatically show you its location on Google Maps - from there it may be immediately obvious that it is a tiny rural town or is surronded by vacant developable land etc.
Alternatively, you may need to briefly apply the ‘City / Region Factors’ we discussed to see if it is actually a diversified major regional town that may be worth considering. You may also need to quickly check the zoning to see if the land is actually developable.
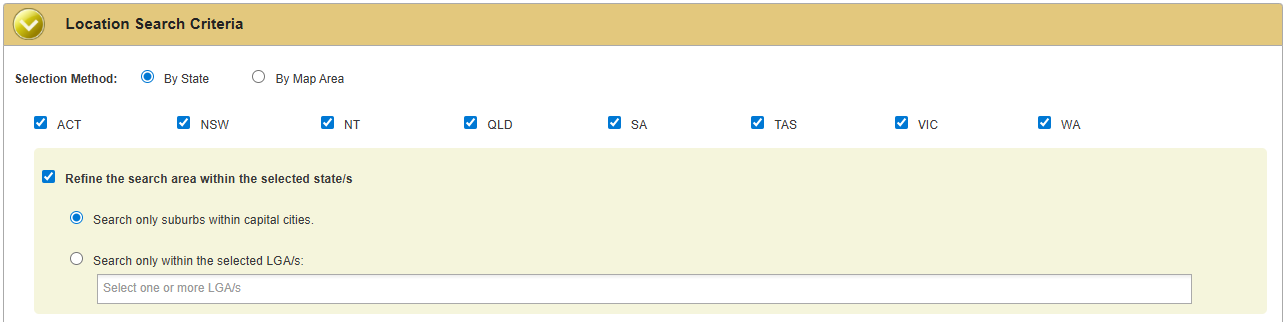
Noting that if your risk tolerance is capital cities only (which I don’t recommend…) or you want to search within a specific LGA you can use the below function to limit the geography of your search.
Step 2: For the remaining suburbs, identify and disregard all areas that have already grown more than 50% over the past 3 years.
To some extent this should be obvious based on what state the suburb is located in.
For example, as I write this in late 2025 / early 2026 a lot of suburbs in WA, QLD and SA have very high DSR scores because the market is very hot there still; however, we know that over the past 3 years these areas have grown well over 50% - depending on how many suburbs in these areas pop up you may even want to consider exluding the entire state from your search in the ‘Location Search Criteria’ tab.

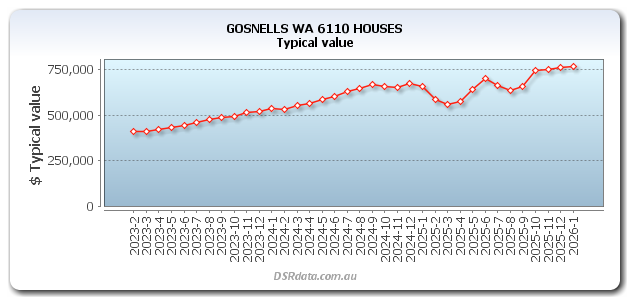
However, depending on when you are reading this, it may not actually be very obvious and in which case you can do a quick check on the ‘Typical Price’ graphs either in DSR or on resources like ‘OnTheHouse’ and get a quick sense about how much growth it has seen in the past three years and do any manual calculations necessary. Please see the below example of Gosnells, WA where it is clear it has grown a lot.
Noting again, you do not need to do this for every single suburb - just do this for those suburbs which survived the cull you did in step 1 above. If by the end of this step you have less than 5 suburbs, go further down the list of DSR Scores and include the suburbs with the next highest scores into the shortlist.
Step 3:For the remaining suburbs, consider whether there are any other suburbs with high DSR Scores which are in close proximity
In this step we want to see if there is a “cluster of strength” in a specific area, we do this by checking if there are suburbs with high DSR Scores which are surronding any of the remaining suburbs on your shortlist - i.e. maybe they are next to each other or a few suburbs a part.
This is important as it provides us with more confidence that our shortlisted suburb has a strong imbalance of supply and demand - rather than being a once off / outlier suburb.
You can do this by looking at Google Maps and checking if the suburbs nearby which are also in the filtered list - however, it is probably better to search them in the “Suburb Analyser” section manually as they may not show up in your list due to reasons like price etc.
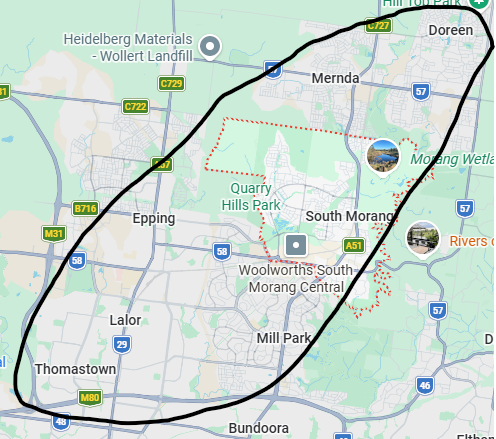
For example, if South Morang, VIC was one of my remaining shortlisted suburbs I would be checking whether suburbs within the ring I have drawn below also have good DSR Scores and supply / demand dynamics. If so, this is a very positive sign and something to consider when weighing up which suburb you choose to ultimately invest in.
Noting that you can also consider the cluster effect from a more macro perspective - for example, you may notice that there are a lot of suburbs from a specific State or City with great supply / demand dynamics.
Just to be clear, this doesn’t mean you just invest anywhere in that State / City - this just helps you identify a pattern of strong data which should give you some confidence in your final investment decision. For example, as I write this in late 2025 / early 2026 most of my shortlist is dominated by VIC suburbs, which gives me confidence that certain suburbs in this state will experience price growth.
Similarly, you may notice a State / City which has a few suburbs popping up in your filtered list but is not the most common - which could suggest it is an emerging market that is gaining strength. For example, as I write this in late 2025 / early 2026 there are a few suburbs in TAS and the ACT which are popping up in my shortlists which suggests these may be emerging markets to also consider (hint hint).
Lastly, I just wanted to flag that if you end up using ‘DSR-3’ they have ‘Heat Map’ function which makes this process of determing clusters of strong data a lot easier - they have a tutorial on YouTube.
Final Step:Choose the strongest remaining suburbs from your shortlist (no more than 5, ideally 3) to compare in an excel spreadsheet with all of the data factors discussed in this ‘Step 4 - Suburb Selection’.
Depending on your level of confidence in the Dex Scores / DSR Scores and the results of your “cluster effect” analysis you may not need to go all out and do a full in-depth analysis comparing data metrics, trends etc.
However, I think it is useful to have it all in a spreadsheet side-by-side so you can see where some suburbs are better than others and what trade-offs you need to make.
Because I am a generous man here is a link to a spreadsheet which you can populate - I have coded the cells so they are linked to the target ranges I have mentioned in this website.
I will say this one more time, this is not a perfect science and there is no perfect suburb. So at some point you need to back yourself and pick a suburb/s to focus on if it meets the data factors we have discussed - MAKE A DECISION AND TAKE ACTION, INVEST!