Step 4 - Suburb Selection
Data Metric
Days on market
The Days on Market, is the number of days a property is advertised for sale before it sells.
A property is considered on the market as soon as the real estate agent lists the property for sale on websites like realestate.com. Once the property has sold, the agent will indicate this on the property website.
That time of advertising represents the Days on Market.
Rental growth
Rental growth refers to the increase in rental prices paid by tenants in area across a certain period of time, expressed as a percentage.
Auction clearance rate
Auction clearance rate, is the number of properties that sell as a percentage of those that go to auction.
Vendor discounting
The vendor discount is the difference between the original asking price of a property for sale and the eventual sale price.
Online Search Interest
The ratio of the number of people searching online for property versus the number of properties available for sale
Source
Paid: all platforms I mentioned before
Free: HtAG (free version)
Paid: HtAG, Suburbs Finder
Free: SQM, Onthehouse, HtAG (free version)
Note: I recommend triangulating these free sources as they report slightly different numbers.
Paid: all platforms I mentioned before
Free: HtAG (free version)
Paid: all platforms I mentioned before
Free: N/A
Paid: all platforms I mentioned above
Free: N/A
Target Range
Greater than 70%
2% or lower, ideally this is at or below 0% (i.e. people are paying above the listed price).
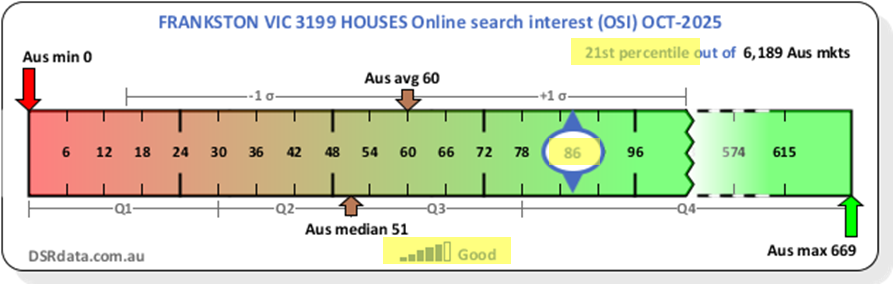
If you are using DSR: around 70 or higher (i.e. in the 25th percentile or higher).
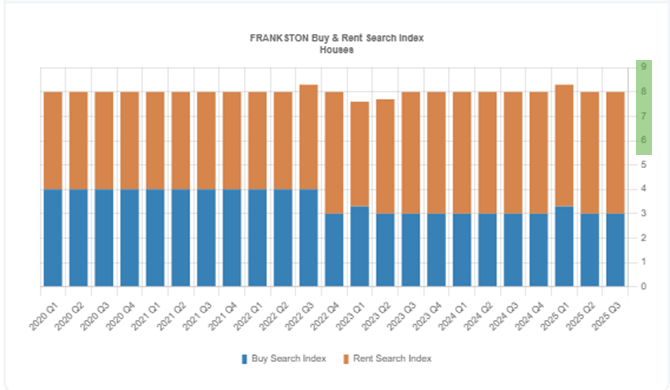
If you are using HtAG: you want to be above 6 (noting that this threshold includes rental searches).
The other paid platforms will have guidance on relevant target ranges.
At least less than 65 days, but I generally like to see lower than 45 days on market.
0 - 35 days is considered a high demand (hot) market
35 - 65 days is considered a balanced (warm) market
65+ days is considered a low demand (cold) market
At least greater than 0% over the past 12 months.
Anything from 0 - 5% in 12 months is good.
Anything over 5% in 12 months is great.
Trend Analysis and Guidance
Downwards trends over at least the past 3 months.
The below graph is a perfect example of a good trend line (in green). It started at a value of around 60 days and has consistently been decreasing and is now clearly a hot market at just above 25 days on market.
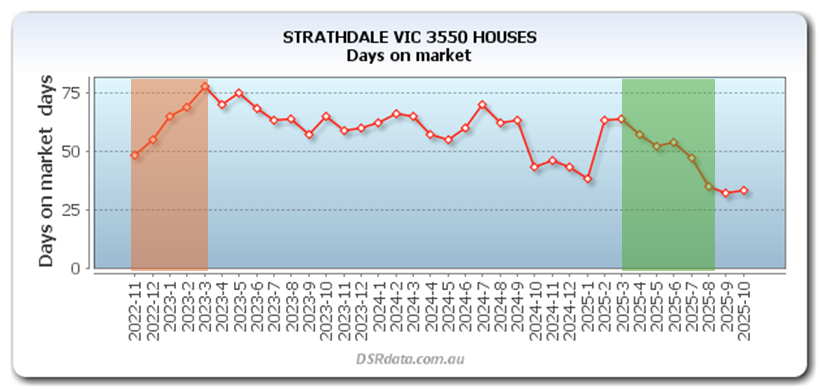
At the start of the graph (in red) you can also see an example of a bad trendline, which shows you how important analyzing trend lines is. At the start of the trend it is sitting at 50 days, which is technically within our threshold, but you would have made a mistake in investing in this suburb at that time because the days on market actually increased continually over the next few months and it never recovered for the next 3 or so years. This is why trend analysis is very important.
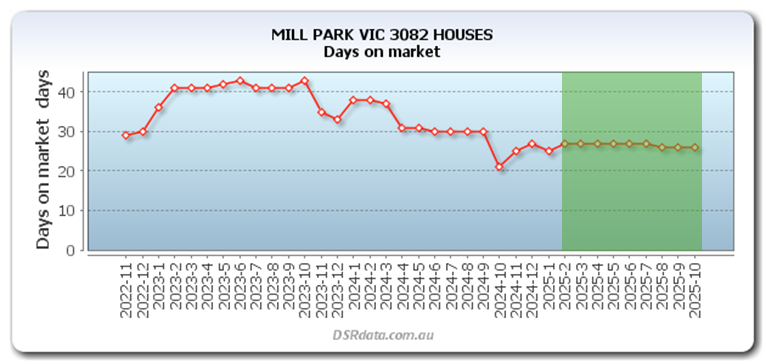
Similar to the other metrics we have discussed previously, if the trend is flat that is not a concern if it is consistently at a number that is very strong (i.e. under 35 days). For example, the below is consistently sitting at 26 days which indicates it is clearly an area with consistently high demand.
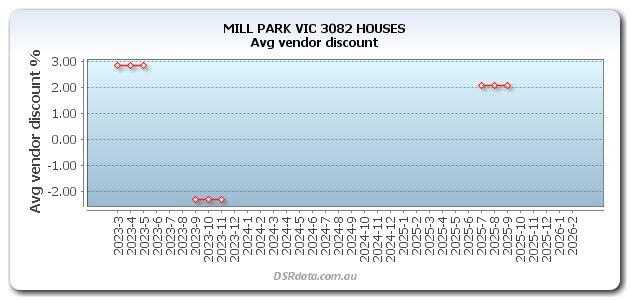
For those people using DSR, you should note that sometimes the vendor discounting rate is not always consistently or accurately recorded, and in some instances no value is provided - see the below as an example. In these cases you can call agents in the area to ask if prices are going above, within or the below quoted range (you can also get a good idea based on the sold section of realestate.com.au).
Flexibility
Low
This is the most important indicator of demand.
For this reason, this statistic has a low flexibility and personally I wouldn’t be investing in any suburbs with above 65 days on market.
Depending on your goals, you may want to be even more strict and limit your shortlist to suburbs with a days on market of at least 45 and below (this is generally what I do).
Medium
You can be slightly flexible on this as it isn’t the most important metric; however, you should be skeptical of investing in suburbs where rents have declined (i.e. a negative percentage) in the past 12 months.
If the suburb only or primarily does auctions then the flexibility on this is Low-Medium.
If the suburb doesn't really do auctions then ignore this metric.
You can assess this by looking at realestate.com.au listings or calling agents in the area. But generally speaking, this will only be relevant to parts of Melbourne, Sydney and maybe Brisbane now.
Medium-High
I have found that the vendor discounting data can sometimes be misleading when read in isolation as it can’t account for when agents do things such as listing a property for an inaccurate / unrealistic price which can skew the discounting data.
For this reason, it is important to not automatically veto suburbs because of a few months of vendor discounting data above 2% - you need to consider it in the context of the other more important demand factors such as ‘days on market’.
Rationale
High days on market indicate a market with lots of listing and limited pressure on prices.
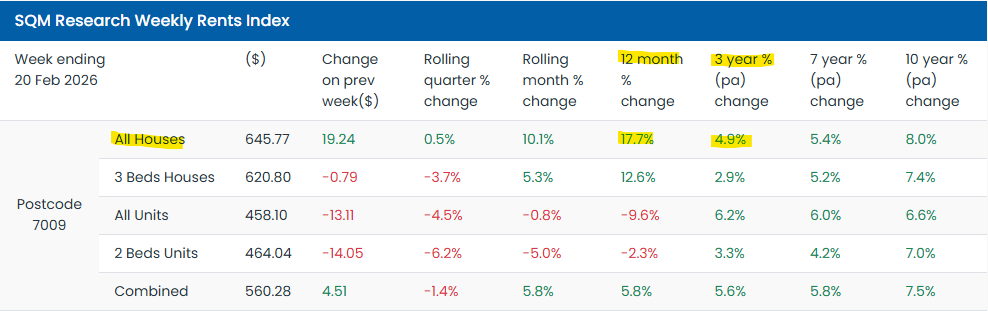
You should also consider reviewing the 36 month (i.e. 3-year) change in rents to see if that is also positive.
Here is an example of how you can do this on SQM (my favourite source for this data…).
Increasing trend for at least three months or consistently high trend.
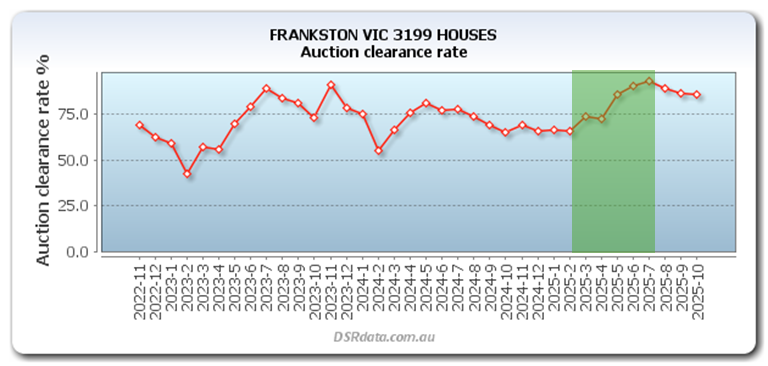
The below is an example of an increasing trend, where it has started from below our threshold and has been consistently increasing and is now comfortably and consistently above the 70% threshold.
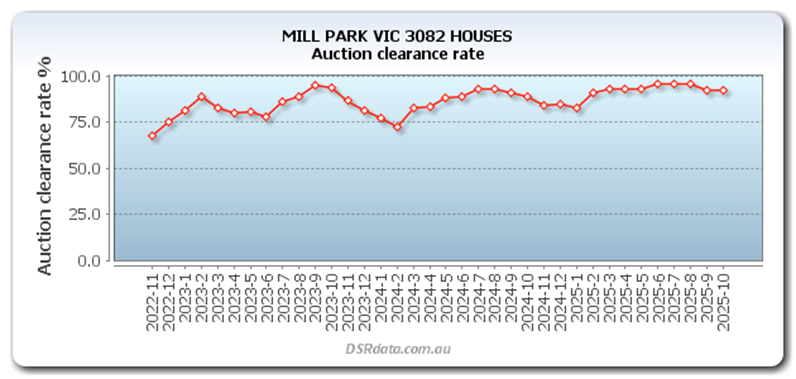
The below is an example of a suburb that has consistently high auction clearance rates.
Consistently below 2% for at least 3 months.
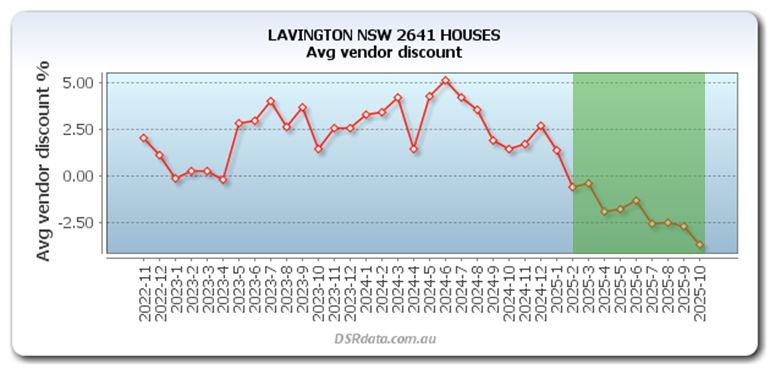
If you are using DSR, you will be able to see the trend in vendor discounting over a period of time- the below is an example of a good trend where has dipped comfortably below 0% and is sitting at -3% meaning people are buying properties for more than the listed price.
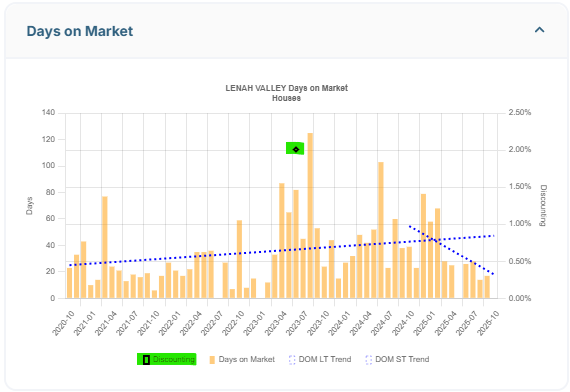
If you are using HtAG, you will only be able to see if there has been discounting (i.e. if houses sold for less than the advertised price). Meaning that as long as you don't see the black dot in green below, it means that there has been no discounting (i.e. a good thing).
Consistently at or above the target range for at least 3 months.
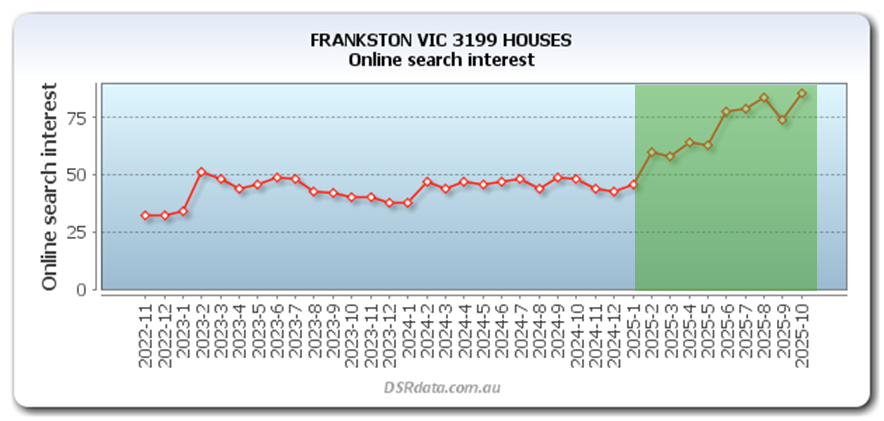
Here is an example of a positive online search interest value and trend using DSR:
Here is an example using HtAG, noting that this platform helpfully also splits up the 'buy' and 'rent' searches (the threshold I mentioned is a combined number - i.e. the below suburb passed the threshold comfortably).
High
There is quite a bit of flexibility on this factor, if all the other demand factors are looking positive then it does not matter too much if the online search interest does not meet the threshold.
Growing rent in an area is often followed by growing house prices so it can be a good indicator on consistent demand / price growth.
Lower auction clearance rate means unfavorable market conditions where buyer demand is not very high, which is not good for capital growth.
If this metric is negative it means that properties are selling for above the listing price and the market is very hot and prices are increasing fast.
Lower online search interest means there is not much interest in the suburb in comparison to listing numbers - i.e. low demand.
High online search means a lot of buyers are looking into this suburb compared to the number of listings - i.e. high demand.